


260 Brocade Network Advisor IP User Manual
53-1003056-01
Performance monitors
7
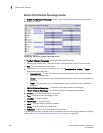
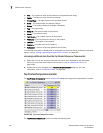
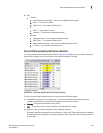
• Max — The maximum value of the measure in the specified time range.
• Fabric — The fabric to which the device belongs.
• Product Type — The type of product (for example, switch).
• State — The product state (for example, Offline).
• Status — The product status (for example, Reachable).
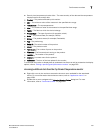
• Tag — The product tag.
• Serial # — The serial number of the product.
• Model — The product model.
• Port Count — The number of ports on the product.
• Firmware — The firmware level running on the product.
• Location — The location of the product.
• Contact — A contact name for the product.
• Refreshed — The time of the last update for the monitor.
To customize the monitor to display data by a selected time frame as well as customize the display
options, refer to “Editing a preconfigured performance monitor” on page 263.
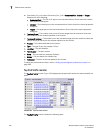
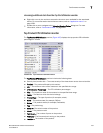
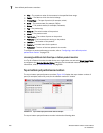
Accessing additional data from the Top Product Response Time monitor
• Right-click a row in the monitor to access the shortcut menu available for the associated
device. For more information about shortcut menus, refer to “Application menus” on
page 1261.
• Double-click a row to navigate to the Historical Graphs/Tables dialog box. For more
information, refer to “Performance Data” on page 969.
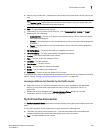
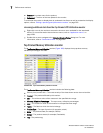
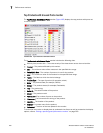
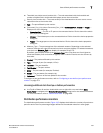
Top Product Temperature monitor
The Top Product Temperature monitor (Figure 108) displays the top product temperature in a table.
FIGURE 108 Top Product Temperature monitor
The Top Product Temperature monitor includes the following data: