


536 Brocade Network Advisor IP User Manual
53-1003056-01
DCB performance
16
DCB performance
Performance monitoring provides details about the quantity of traffic and errors a specific port or
device generates on the fabric over a specific time frame. You can also use Performance features
to indicate the devices that create the most traffic and to identify the ports that are most
congested.
The Performance menu items launch either SAN or IP performance dialog boxes based on which
tab you select. Note the following points:
• The DCB configuration dialog box can be launched from either the SAN or IP tab.
• The appropriate IP Performance tab launches depending on whether you selected a port or a
switch.
Real-time performance graph
You can monitor a device’s performance through a performance graph that displays transmit and
receive data. The graphs can be sorted by the column headers. You can create multiple real-time
performance graph instances.
Generating a real-time performance graph from the SAN tab
To generate a real-time performance graph for a FOS device, complete the following steps.
1. Click the SAN tab.
2. Select a DCB port from the DCB Configuration dialog box, and select Real Time Graph from the
Performance list.
A message displays, prompting you to close the DCB Configuration dialog box.
3. Click OK to close the DCB Configuration dialog and open the Performance dialog box.
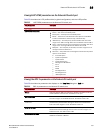
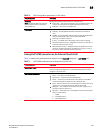
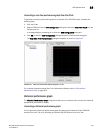
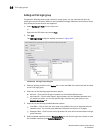
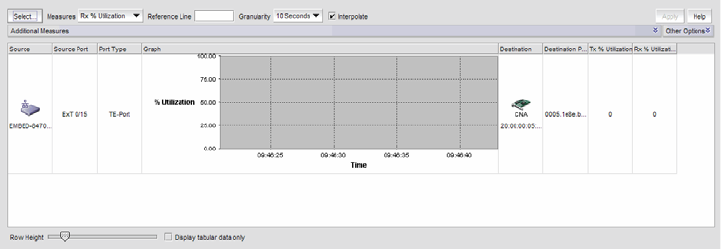
The Real Time Performance Graphs dialog box displays, as shown in Figure 196.
FIGURE 196 Real Time Performance Graphs dialog box - SAN tab
For complete information about Real Time Performance Graphs, refer to “SAN real-time
performance data” on page 976.