


270 Brocade Network Advisor IP User Manual
53-1003056-01
User-defined performance monitors
7
To configure a time series performance monitor, refer to “Configuring a user-defined product
performance monitor” on page 270 or “Configuring a user-defined port performance monitor” on
page 273.
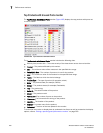
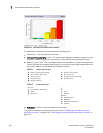
Top sFlows performance monitors
The top sFlows performance monitors display the top sFlow measures based on available flow data
in a table.
The top sFlow performance monitor includes the following data:
• MACs, IP Addresses, VMs, or VLANs — The number of products and associated ports affected
by this monitor.
• Port In — The in port number.
• Port Out — The out port number.
• MBytes — The port speed.
• Frames — The number of frames.
• Percentage — The sFlow percentage for the product or port.
To configure an sFlow performance monitor, refer to “Configuring a user-defined sFlow
performance monitor” on page 275.
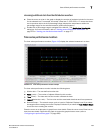
Accessing additional data from the sFlow monitors
• Double-click a device row to navigate to the sFlow Monitor Report dialog box. For more
information, refer to “Displaying sFlow monitoring reports” on page 1038.
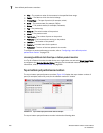
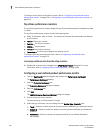
Configuring a user-defined product performance monitor
1. From the Dashboards expand navigation bar, double-click Performance Dashboard.
The Performance Dashboard displays.
2. Click the Customize Dashboard icon.
The Customize Dashboard dialog box displays.
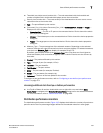
3. Click the Performance tab.
4. Click Add.
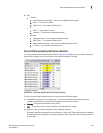
The Add Performance Dashboard Monitor dialog box displays.
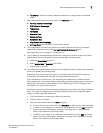
5. Enter a unique title for the monitor.
The title can be up to 256 characters in length.
6. Select the type of monitor you are creating from the Monitor Type - Products area:
• Top N — Select to monitor the top N (number) products affected by the selected measure.
• Bottom N — Select to monitor the bottom N (number) products affected by the selected
measure.
• Distribution — Select to monitor the selected measure for five defined distribution
percentages.