


Brocade Network Advisor IP User Manual 1011
53-1003056-01
IP historical performance monitoring
33
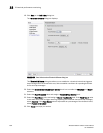
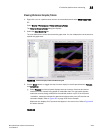
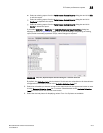
6. Optional:Once data collection begins, the data is presented on the chart (if Graph is selected)
or table (if Table is selected).
If a graph is displayed, the legend under the graph shows what data each color represents.
Also, you see the following text:
• MIB: Shows the name of the MIB object that is being used to collect the data and the
device that is being polled. If the target is a port, then the interface ID is also displayed.
• EXP: Shows the name of the expression being used to collect the data and the device that
is being polled. If the target is a port, then the interface ID is also displayed.
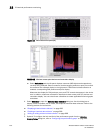
Each collectible is represented by a different color and the color for a collectible can change as
new data is collected.
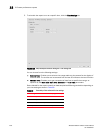
If a table is displayed, the first column displays the time of the collection. The remaining
columns display the value of each collectible at the specified time. There is one column for
every collectible you select to display.
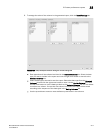
7. Optional: To add the performance monitor published widget to the active dashboard, click Save
As Widget.
The Performance Dashboard Monitor Title dialog box displays.
Select Add the Widget to active dashboard (Product status and Traffic) check box to enable the
published widget. By default, the check box is enabled.
Click OK.
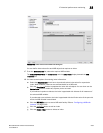
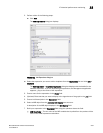
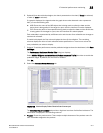
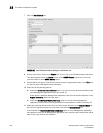
8. Select the Collection Status Summary tab.
FIGURE 416 Historical Graphs/Tables Collection Status Summary tab
The Collection Status Summary tab provides a high-level overview of all defined collectors. The
information is displayed in the following columns:
• Product - Shows the product name. There maybe multiple instances of the product name for
each collectible assigned to the product.