


734 Brocade Network Advisor IP User Manual
53-1003056-01
Element Manager interface overview
22
• Collapse the table.
Refer to “Customizing application tables” on page 294 for information on table functions.
Performance data
You can use the following options to monitor the performance data of a switch:
• Real Time Graph/Table
• Historical Graph/Table
Real-time performance monitoring
Real-time performance monitoring allows you to view a snapshot of the current performance data.
To monitor the real-time performance of the switch, complete the following steps.
NOTE
You can monitor real-time graphs for a slot, multiple slots, a trunk, multiple trunks, a port, or multiple
ports.
1. In the Element Manager, right-click a slot (or slots), trunk (or trunks), or port (or ports) and
select Performance > Real Time Graph/Table.
Or
Select a slot (or slots), trunk (or trunks), or port (or ports), and select Real Time Graph/Table
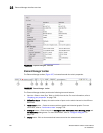
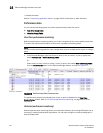
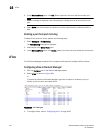
from the Performance button on the Element Manager toolbar, as shown in Figure 272.
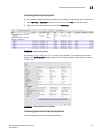
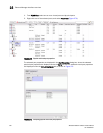
FIGURE 272 Real Time Graph/Table performance data
The performance data for the selected slots, trunks, or ports is displayed in the Real Time
Graphs/Tables window. Refer to “IP real-time performance monitoring” on page 983 for more
information.
Historical performance monitoring
Historical performance monitoring allows you create data collectors by choosing MIB object and by
choosing or creating mathematical expressions. You can also configure a historical data graph or
table to display data.