


276 Brocade Network Advisor IP User Manual
53-1003056-01
User-defined performance monitors
7
Valid values are from 1 through 25. The default is 10.
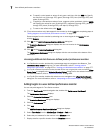
7. Configure the monitor to show only values greater than or less than a specified value by
completing the following steps.
a. Select the Show values check box.
b. Select greater than or less than from the list.
c. Enter a value in the field.
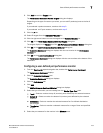
8. Add targets for the monitor by clicking Add and completing the steps in “Adding targets to a
user-defined performance monitor” on page 272.
9. Remove targets from the monitor by selecting one or more targets in the Targets list and
clicking Remove.
10. Click OK on the Add Performance Dashboard Monitor dialog box.
The Customize Dashboard dialog box displays with the new monitor in the Performance
Monitors list.
11. Click OK on the Customize Dashboard dialog box.
The Performance Dashboard dialog box displays with the new monitors at the bottom of the
dashboard.
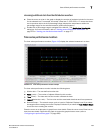
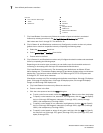
Accessing additional data from user-defined sFlow performance monitors
• In a Top N sFlow monitor, double-click a device row to navigate to the sFlow Monitor Report
dialog box. For more information, refer to “Interpreting an sFlow traffic report” on page 1041.
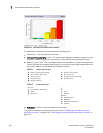
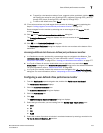
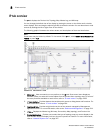
Viewing product distribution data details
Each bar on the product distribution graph maps directly to one of the five percentage ranges
defined for the distribution performance monitor (refer to “Distribution performance monitors” on
page 267).
1. Double-click a bar in the graph.
The Monitor_Title Data Details dialog box displays.
2. Review the data.
The product distribution data details include the following fields and components:
• Product — The name of the product affected by the selected measure.
• Measure_Type — This column depends on which measure you select for the monitor.
Memory Utilization Percentage — The memory utilization percentage for the product.
CPU Utilization Percentage — The CPU utilization percentage for the product.
Temperature — The temperature in Celsius for the product.
Fan Speed — The fan speed in RPM for the product.
Response Time — The response time in seconds for the product.
System Up Time — The system up time in days for the product.
Ports Not In Use — The number of ports not in use for the product.
Ping Packet Loss Percentage — The ping packet loss percentage for the product.
AP Client Count — The number of AP clients for the product.