


1096 Brocade Network Advisor IP User Manual
53-1003056-01
Viewing PoE performance
35
Monitoring real time power performance on ports
To view real time power performance graphs or tables, complete the following steps.
1. Select Monitor > Power Center.
The Power Center dialog box displays.
2. Select a a port from the Port Data list.
3. Select Real Time Power Graphs/Tables from the Graphs/Tables list.
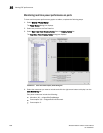
The Real Time Power Graphs/Tables dialog box displays.
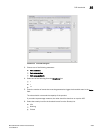
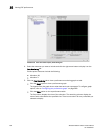
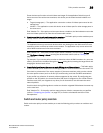
FIGURE 457 Real Time Power Graphs/Tables dialog box
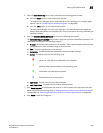
4. Select the measures you want to include and click the right arrow button to display it on the
Data Monitoring tab.
Port power measures include the following:
• Allocation (W) — snAgentPoePortWattage
• Consumption (W) — snAgentPoePortConsumed
• Consumption %