


1042 Brocade Network Advisor IP User Manual
53-1003056-01
IP Traffic analyzer monitoring and sFlow reports
33
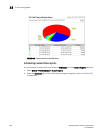
• The 12 and 24 hour graphs show bars (not stacked bars). Each bar represents a flow
aggregated for a 1-hour period. There are six bars to a set, starting with red and ending with
gray. Each set represents all the flows in the system aggregated for a 1-hour period, beginning
with the time shown on the x-axis. You see this time halfway between the set of six bars.
The first five colors used on the graph represent the top five resource users. The last color (gray by
default) represents all the remaining users in the device group. The color legend defines the
individual source and destination of the traffic.
If Table is enabled, a table appears under the graph and presents details about the top users. The
number of pairs displayed depends on the value of the MaxPairsToShow parameter on the Options
dialog box (refer to “Configuring sFlow monitoring preferences” on page 164). Combined usage by
all remaining users and a total for all users appear at the end of the table. The number of top
resource users shown and the number of rows displayed on a report depends on how sFlow
parameters in the Options dialog box are defined.
Refer to the following sections to interpret the table:
• “Viewing top MAC talkers” on page 1042
• “Viewing top VLAN talkers” on page 1043
• “Viewing all Layer 3 and Layer 4 traffic” on page 1044
• “Viewing all IPv4 Layer 3 or Layer 4 Top Talkers” on page 1044
• “Viewing IPv4 – top TCP talkers” on page 1045
• “Viewing IPv4 – top UDP talkers” on page 1047
• “Viewing IPv4 – top ICMP talkers” on page 1048
• “Viewing IPv6 Top Talkers” on page 1049, discusses the following reports:
- Top IPV6 Talkers using all Layer 4 services
- Top TCP Talkers
- Top UDP Talkers
- Top ICMP Talkers
- Top IPV6 Talkers of all Layer 4 service, excluding TCP, UDP, and ICMP
• “Viewing other Layer 3 or Layer 4 Top Talkers” on page 1050
• “Enabling and viewing TCP reports” on page 1051
• “Viewing BGP paths report” on page 1053
The sFlow report that you request may not display all the data collected. The reports may be
truncated if there are more rows than the limit specified in the Options dialog box file. To view the
entire report, you must export it to a tab-separated file.
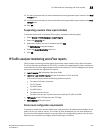
Viewing top MAC talkers
The Top MAC Talkers report shows the top pairs of source and destination MAC addresses being
used on the network. Follow the steps below to display the report.
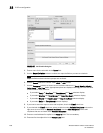
1. Select Monitor > Traffic Analysis > Monitor sFlow.
2. On the Monitor sFlow dialog box, choose one of the following options:
• To view a report for a product group, click the report icon for the product group you want.