1
1-42
McDATA® Sphereon 3032 and 3232 Fabric Switches Installation and Service Manual
General Information
•Diagnostics
• Channel Wrap (FICON management style only)
• Swap Ports (FICON management style only)
• Clear Link Incident Alert(s)
• Reset Port
•Port Binding
• Clear Threshold Alert(s)
Note that these same options are also available when you click a port
graph, then select the Port secondary menu from the Product menu on
the menu bar.
The bottom portion of the Performance View displays cumulative
statistical information for the port selected in the bar graph. Values
are displayed for transmit and receive traffic, class 2 and 3 statistics,
operational statistics, and error categories. Click a category in the left
frame of the statistics area to display only statistics in that category or
click All to display values for all categories. Click Refresh to update
the data with current data from the port.
The Clear button clears all counters to zero. Selecting this button
displays a Clear Port Statistcs dialog box. Select the appropriate radio
button and click OK to clear all counters to zero on the selected port
only or counters on all ports on the switch.
NOTE: Clearing the counters clears the statistics for all users.
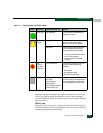
The status bar is located along the bottom of the Element Manager
window. This includes a symbol that displays at the left side of the
bar and messages that display in the panel to the right of the symbol.
The symbol indicates the current operating status of the switch and
the messages display to provide more description of menu options as
you move the cursor over the options under menu bar menus.
If a gray square displays in the status bar (no Ethernet connection), a
reason for the status displays in the Status table at the top of the
Hardware View.


