MMB Web-UI (Web User Interface) Operations
[Degraded] : It shows that a failure has occurred in the component of a certain unit, and the unit is
operated without disconnecting the failed component. It is shown by icon.
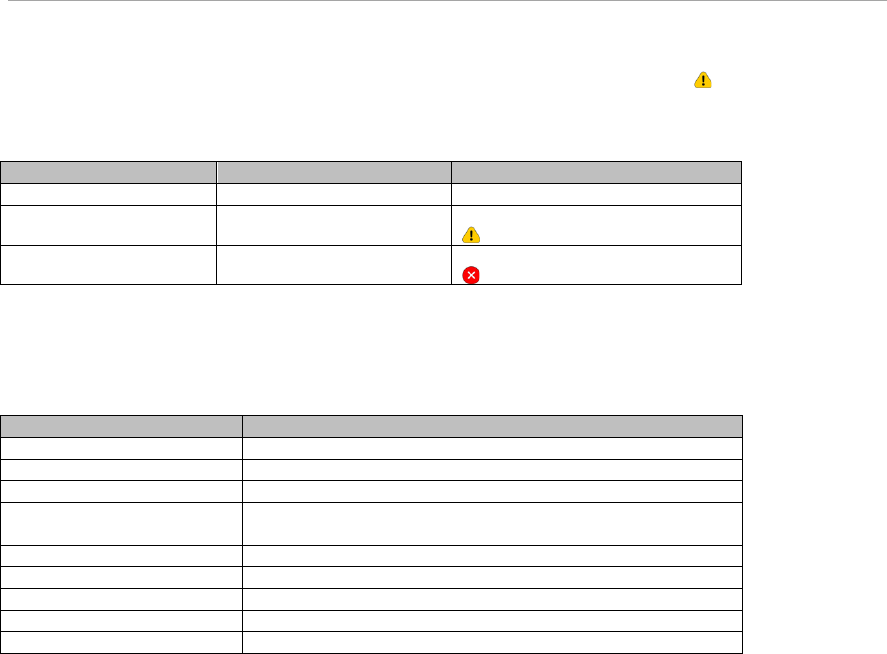
TABLE 1.15 Status of Unit and its Icons
Status
Display Color
Icon
Normal (Normal state)
Green
None
Warning, Degraded
Yellow
Black ‘!’ mark in yellow triangle.
Failed
Red
White ‘X’ in red circle.
Each unit is linked with the window showing the detailed status. However, for units which are not mounted,
there is no window showing the details. Therefore, these units are not linked.
TABLE 1.16 Items displayed in [System Status] Window
Items
Description
Power Supply
Shows the status of PSU
Fans
Shows the status of FAN
Temperature
Shows the status of temperature sensor
SB#0 ~ SB#3
Shows the status of system board
In case of PRIMEQUEST 2400E model, it is SB#0 ~ SB#1
IOU#0 ~ IOU#3
Shows the status of IOU
DU#0 ~ DU#1
Shows the status of DU
OPL
Shows the status of OPL
MMB#0 ~ MMB#1
Shows the status of MMB
PCI_Box#0 ~ PCI_Box#3
Shows the status of PCI_Box which are connected
(1) Menu Operation
[System] – [System Status]
(2) Window Operations
1. Click the link corresponding to each unit when the detailed status of unit is to be confirmed. The
window showing detailed status of each unit appears.
Remarks
The detailed status can also be displayed by selecting the menu of target unit from [System] sub menu
directly. For details on the operations, see “1.2.9 [LEDs] window” ~ “1.2.16 [PCI_Box] Menu”.
1.2.2 [System Event Log] Window
Among the events generated in the PRIMEQUEST 2000 series system, events of MMB and BMC stored in
the current MMB system event log are displayed on the [System Event Log] window in chronological order.
Maximum 32000 events can be stored in system event log. When the entries in the system event log are full,
oldest event log is deleted, and latest event log is stored in system event log.


