


Working with statistics and graphs 137
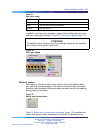
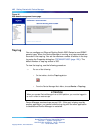
Figure 42
Pie graph
•
"Statistics for single and multiple objects" (page 137)
•
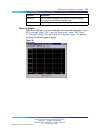
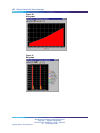
"Viewing statistics as graphs" (page 138)
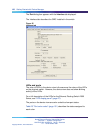
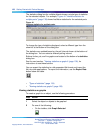
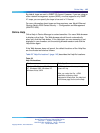
Statistics for single and multiple objects
Statistics for a selected object or objects are displayed in the statistics
dialog box.
The dialog box for a single object shows all six types of statistics for each
counter.
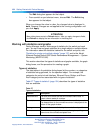
Figure 43
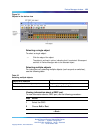
Interface statistics for a single port
Nortel Ethernet Routing Switch 2500 Series
Overview — System Configuration
NN47215-500 (323162-B) 02.02 Standard
4.1 19 November 2007
Copyright © 2007, Nortel Networks
.