


138 Getting Started with Device Manager
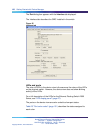
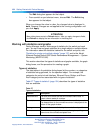
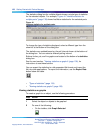
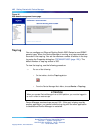
The statistics dialog box for multiple objects shows a single type of statistics
for the selected objects. For example, Figure 44 "Interface statistics for
multiple ports" (page 138) shows LastValue statistics for the selected ports.
Figure 44
Interface statistics for multiple ports
To change the type of statistics displayed, select a different type from the
show list at the bottom of the dialog box.
The statistics are updated based on the poll interval shown at the bottom of
the dialog box. You can select a different polling interval.
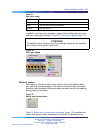
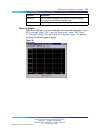
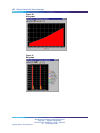
Buttons for bar, pie, and line graphs are located at the bottom of a statistics
dialog box.
See the next section, "Viewing statistics as graphs" (page 138),for
instructions to use these buttons.
You can export the statistics to a tab-separated file format and import the
file into other applications. To export the information, use the Export Data
button below the table.
•
"Types of statistics" (page 134)
•
"Viewing statistics as graphs" (page 138)
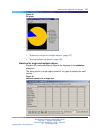
Viewing statistics as graphs
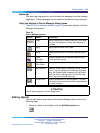
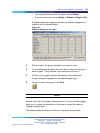
To create a graph for an object, use the following procedure:
Step Action
1
Select the object or objects to be graphed.
2
Do one of the following:
•
On the toolbar, click Graph Selected.
Nortel Ethernet Routing Switch 2500 Series
Overview — System Configuration
NN47215-500 (323162-B) 02.02 Standard
4.1 19 November 2007
Copyright © 2007, Nortel Networks
.