


Working with statistics and graphs 139
•
From the shortcut menu for the object, choose Graph.
•
From the main menu, choose Graph > Chassis or Graph > Port.
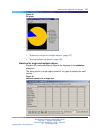
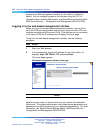
A statistics dialog box appears with tabs for different categories of
statistics for the selected object.
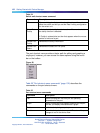
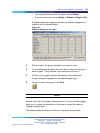
Figure 45
Statistics dialog box for a port
3 Select a tab for the group of statistics you want to view.
4
On the displayed data table, click and drag to select the cells you
want to graph. (They must be in the same row or column.)
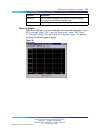
5
Click one of the graph buttons at the bottom of the dialog box
A graph dialog box appears for the selected graph type.
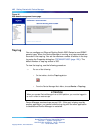
6
To print a copy of the graph, click Print.
—End—
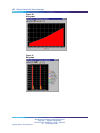
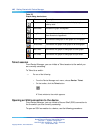
Buttons at the top of the graph dialog boxes for line, area, and bar graphs
allow you to change the orientation of the graph, change the scale, or
change the graph type.
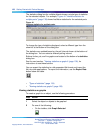
The following table describes the buttons in the graph dialog boxes.
Nortel Ethernet Routing Switch 2500 Series
Overview — System Configuration
NN47215-500 (323162-B) 02.02 Standard
4.1 19 November 2007
Copyright © 2007, Nortel Networks
.