FC-210/310 ADJUSTMENT 2 - 4 February 2002 © TOSHIBA TEC
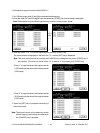
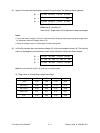
(5) Approx. 2 minutes after the developer material filling is finished, the following display appears:
Ꭾৎ Y:6.30V M:6.38V C:6.38V K:6.38V
Ꭿ ৎ 58%
Ꭽৎ Y:4.00V M:4.00V C:4.00V K:4.00V
Upper line Ꭾ : Current sensor voltages (V)
Middle line Ꭿ : Humidity (%)
Lower line Ꭽ : Target values (V) for adjustment reference voltages
Notes:
• The current sensor voltages (V) shown in Ꭾ automatically change, gradually approaching the target values
for adjustment reference voltages shown in Ꭽ.
• Values are displayed only for the developer materials being filled.
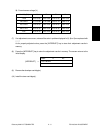
(6) In 30 to 60 seconds, the current sensor voltages (V) in Ꭾ are converged to those in Ꭽ. The humidity
shown in Ꭿ disappears, and the sensor output control values (bit values) are shown instead.
Ꭾৎ Y:4.00V M:4.00V C:4.00V K:4.00V
Ꭿৎ Y: 140 M: 140 C: 140 K: 140
Ꭽৎ Y:4.00V M:4.00V C:4.00V K:4.00V
Note: Be careful that the values in Ꭽ, Ꭾ and Ꭿ vary with humidity.
Ꭽ : Target value (V) for adjustment reference voltage
Humidity (%) Y M C K
~29.9 3.60 3.60 3.50 3.50
30.0~44.9 3.84 3.84 3.74 3.74
45.0~59.9 4.00 4.00 4.00 4.00
60.0~74.9 4.27 4.27 4.27 4.27
75.0~ 4.50 4.50 4.50 4.50


