C H A P T E R 7 Virtual LANs (VLANs)
101
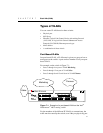
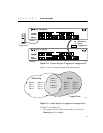
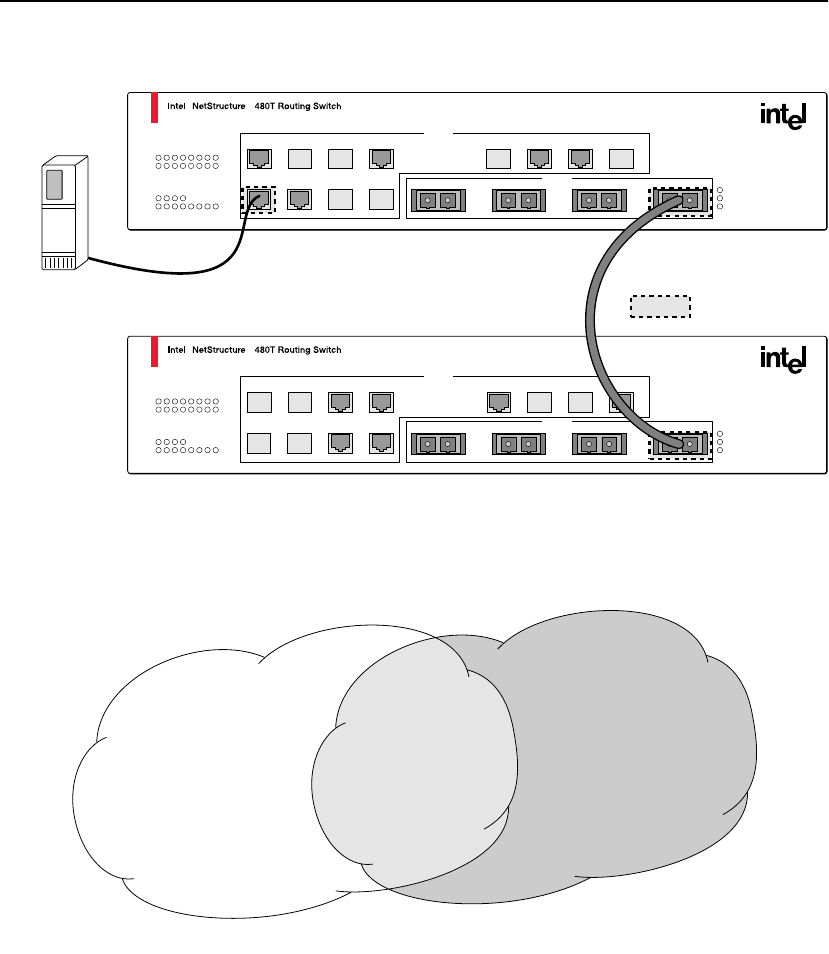
Figure 7.4: Physical diagram of tagged and untagged traffic
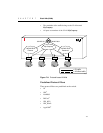
Figure 7.5 shows a logical diagram of the same network.
Figure 7.5: Logical diagram of tagged and untagged traffic
In Figure 7.4 and Figure 7.5:
• The trunk port on each switch carries traffic for both VLAN
Marketing and VLAN Sales.
Switch 1
Switch 2
= Marketing
= Sales
M
S
= Tagged port
480t_001
3421
7865
11 12109
13 161514
S S
S
M
M
M
3421
7865
11 12109
13 161514
S
M
S
M
S
M
802.1Q
Tagged server
®
®
480t_002
*Tagged Ports
Sales
Switch 1
Port 3
Port 5
Port 11
Switch 1
Port 9 *
Port 16 *
Switch 2
Port 2
Port 7
Port 10
Switch 2
Port 16 *
Marketing
Switch 1
Port 2
Port 8
Port 12
Switch 2
Port 1
Port 6
Port 9


