


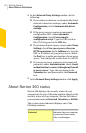
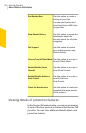

alerts, or Quick Scans. The graph displays the
activities as icon or stripe, and the description for
each icon orstripe is providedat the bottom ofthe
graph.Thepop-upthatappearswhenyoumovethe
mousepointeroveraniconprovidesyouthedetails
about the activity. The ViewDetails link in the
pop-up lets you view additional details about the
activity in the SecurityHistory window. You can
usethetabsatthetopofthegraphtoobtaindetails
for the current month and details for the last two
months.
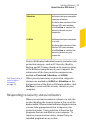
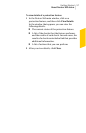
1 To rearrange the organization of files on your
computer.
Optimizing your system helps you maximize the
usable free space on a disk by grouping files based
on how they are accessed. The Optimize option at
the top of the Events graph lets you defragment
your system.
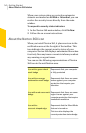
1 ToviewandanalyzetheeffectofNorton360onthe
performance of your computer.
ThePerformancegraphthatappearsatthebottom
of thewindow provides a graphicalrepresentation
ofyourCPUusageandmemoryusage.TheCPUtab
displaysagraphthatrepresentstheoverallsystem
CPU usage and Norton-specific CPU usage. When
you click at any point on the CPU graph and
memory graph, Norton 360 displays a list of the
processesthatconsumemaximumresources atthat
point. It also displays the percentage of usage for
each process. You can click a process that is
available in the list to get more information about
the process in the FileInsight window. The
Memory tab displays a graph that represents
overallmemoryusageandNorton-specificmemory
usage. You can select any of the Zoom options to
obtain magnified view or historical data of the
graphs.
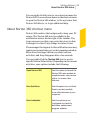
1 To viewthe details of Norton-specificjobs that are
currently running in the background
Monitoring your system'sperformance
About System Insight
60