


User’s Manual
IBM PowerPC 750GX and 750GL RISC Microprocessor
gx_02.fm.(1.2)
March 27, 2006
Programming Model
Page 75 of 377
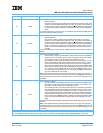
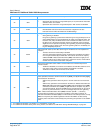
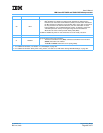
The following tables list the selectable events and their encodings:
• Table 11-2, PMC1 Events—MMCR0[19:25] Select Encodings, on page 352.
• Table 11-3, PMC2 Events—MMCR0[26:31] Select Encodings, on page 352.
• Table 11-4, PMC3 Events—MMCR1[0:4] Select Encodings, on page 353.
• Table 11-5, PMC4 Events—MMCR1[5:9] Select Encodings, on page 354.
The PMC registers can be accessed with mtspr and mfspr using following SPR numbers:
• PMC1 is SPR 953
• PMC2 is SPR 954
• PMC3 is SPR 957
• PMC4 is SPR 958
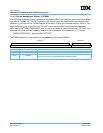
User Performance-Monitor Counter Registers (UPMCn)
The contents of the PMC1–PMC4 are reflected to UPMC1–UPMC4, which can be read by user-level soft-
ware. The UPMC registers can be read with mfspr using the following SPR numbers:
• UPMC1 is SPR 937
• UPMC2 is SPR 938
• UPMC3 is SPR 941
• UPMC4 is SPR 942
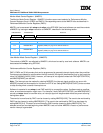
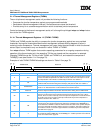
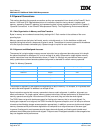
Sampled Instruction Address Register (SIA)
The Sampled Instruction Address Register (SIA) is a supervisor-level register that contains the effective
address of an instruction executing at or around the time that the processor signals the performance-monitor
interrupt condition.
If the performance-monitor interrupt is triggered by a threshold event, the SIA contains the exact instruction
(called the sampled instruction) that caused the counter to overflow.
If the performance-monitor interrupt was caused by something besides a threshold event, the SIA contains
the address of the last instruction completed during that cycle. SIA can be accessed with the mtspr and
mfspr instructions using SPR 955.
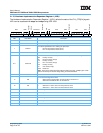
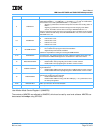
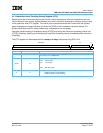
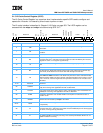
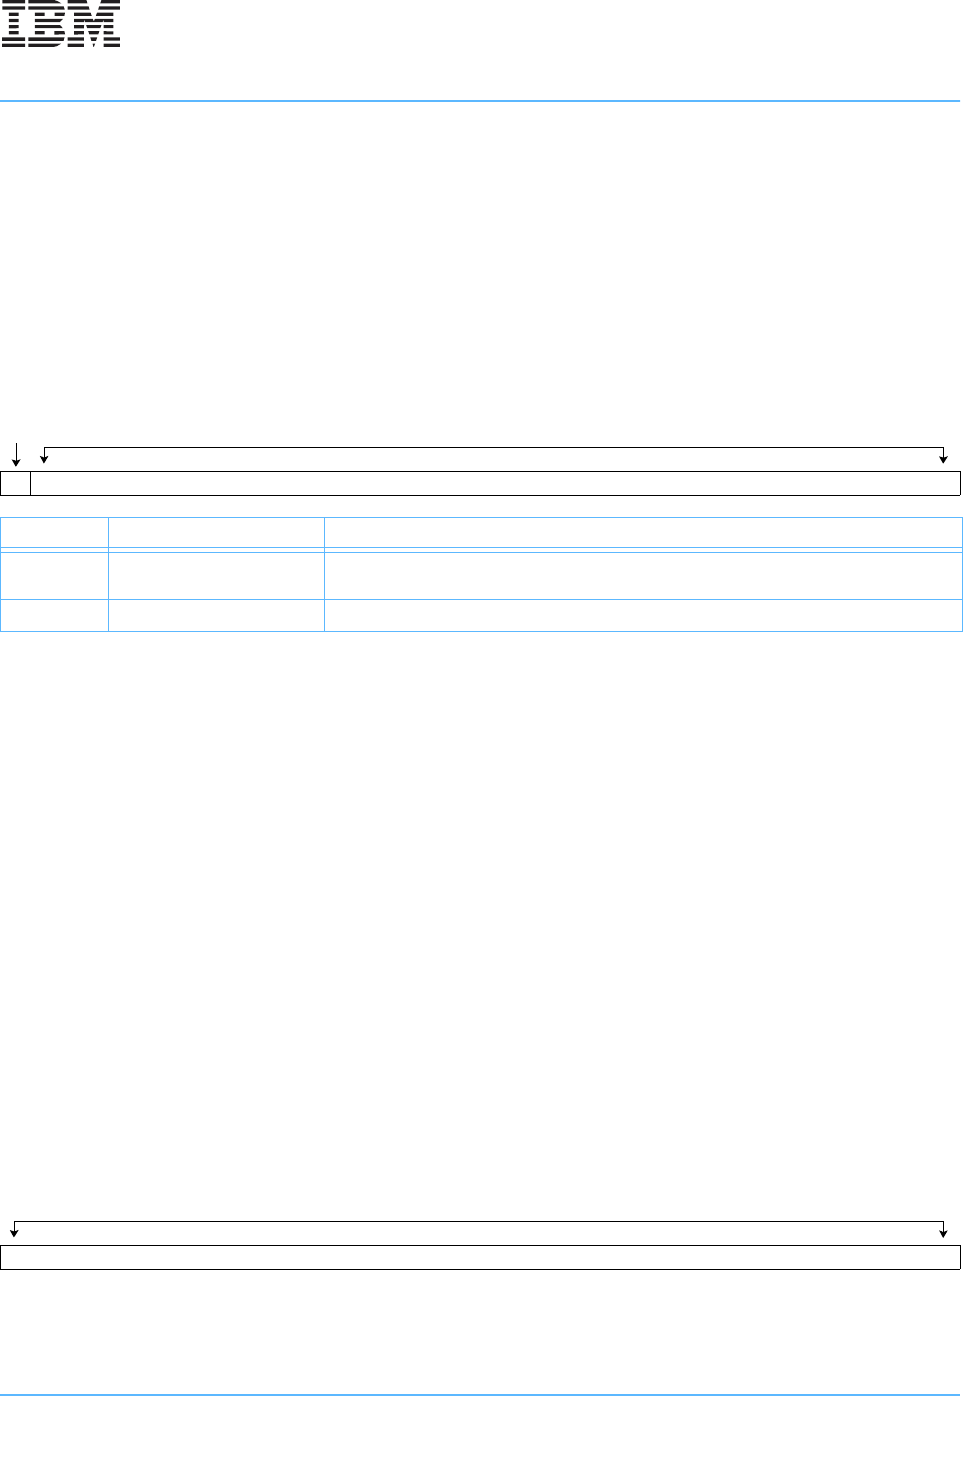
OV Counter Value
012345678910111213141516171819202122232425262728293031
Bits Field Name Description
0OV
Overflow. When this bit is set it indicates that this counter has reached its maximum
value.
1:31 Counter Value Indicates the number of occurrences of the specified event.
Instruction Address
012345678910111213141516171819202122232425262728293031