


Viewing Statistics and Remote Monitoring 429
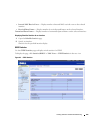
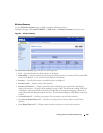
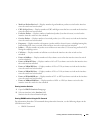
Utilization Summary
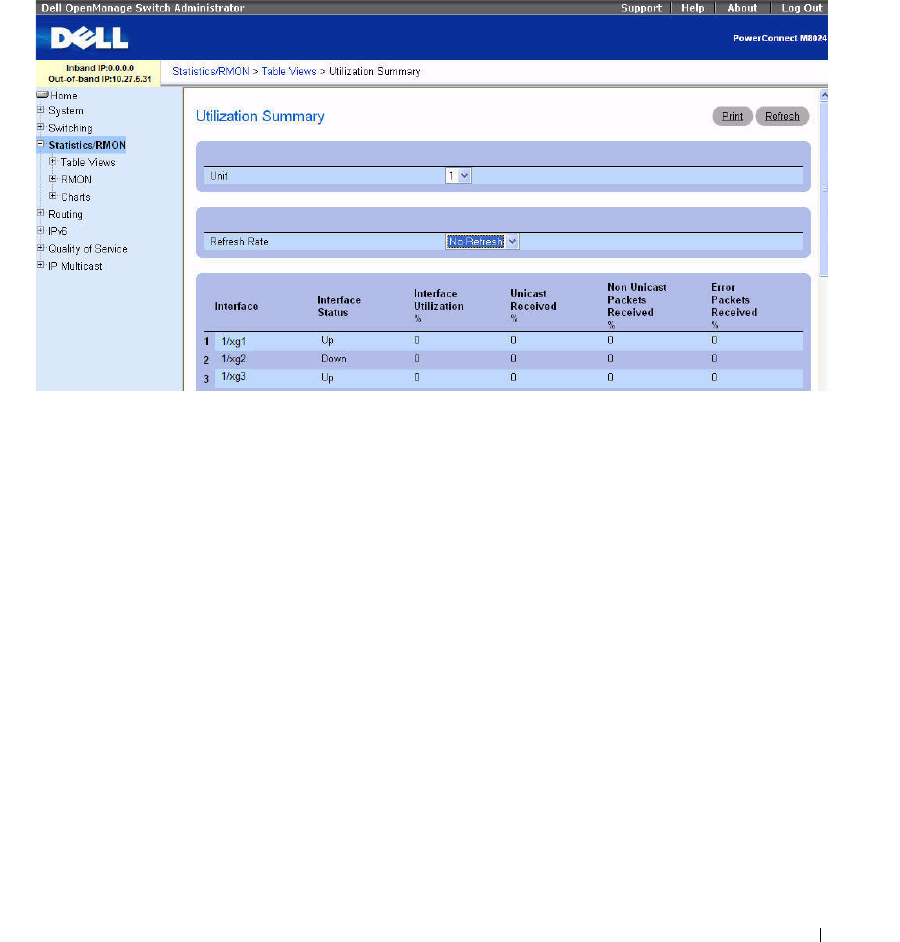
Use the
Utilization Summary
page to display interface utilization statistics.
To display the page, click Statistics/RMON > Table Vie ws > Utilization Summary in the tree view.
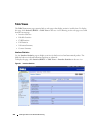
Figure 8-5. Utilization Summary
The Utilization Summary page contains the following fields:
•
Unit
— Specifies the unit for which statistics are displayed.
•
Refresh Rate
— Specifies amount of time that passes before statistics are refreshed. The possible field
values are No Refresh, 15, 30, and 60 seconds. Default is No Refresh.
•
Interface
— Specifies the interface for which statistics are displayed.
•
Interface Status
— Displays status of the interface.
•
Interface Utilization %
— Displays network interface utilization percentage based on the duplex
mode of the interface. The range of this reading is from 0 to 200%. The maximum reading of 200% for
a full duplex connection indicates that 100% of bandwidth of incoming and outgoing connections is
used by the traffic travelling through the interface. The maximum reading for a half duplex connection
is 100%.
•
Unicast Received
%
— Displays percentage of Unicast packets received on the interface.
•
Non Unicast Packets Received %
— Displays percentage of non-Unicast packets received on the
interface.
•
Error Packets Received
%
— Displays number packets with errors received on the interface.