


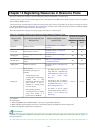
Rate Output time span Output device count
Daily Last year 30
Monthly Select "Custom" and specify 5 years 60
Annual Select "Custom" and specify 5 years 60
13.2 Displaying Power Consumption Data Graphs
This section explains how to display power consumption data as graphs.
The power consumption data for each power monitoring target that is registered in the power monitoring environment can be displayed
as graphs.
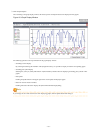
The collected power consumption data and average values of the specified time span and rate can be displayed in line graphs.
Use the following procedure to display power consumption data as graphs.
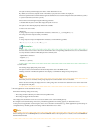
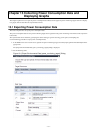
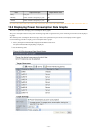
1. Select [Tools]-[Environmental Data Graph] from the ROR console menu.
The [Environmental Data Graph] dialog is displayed.
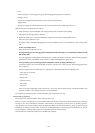
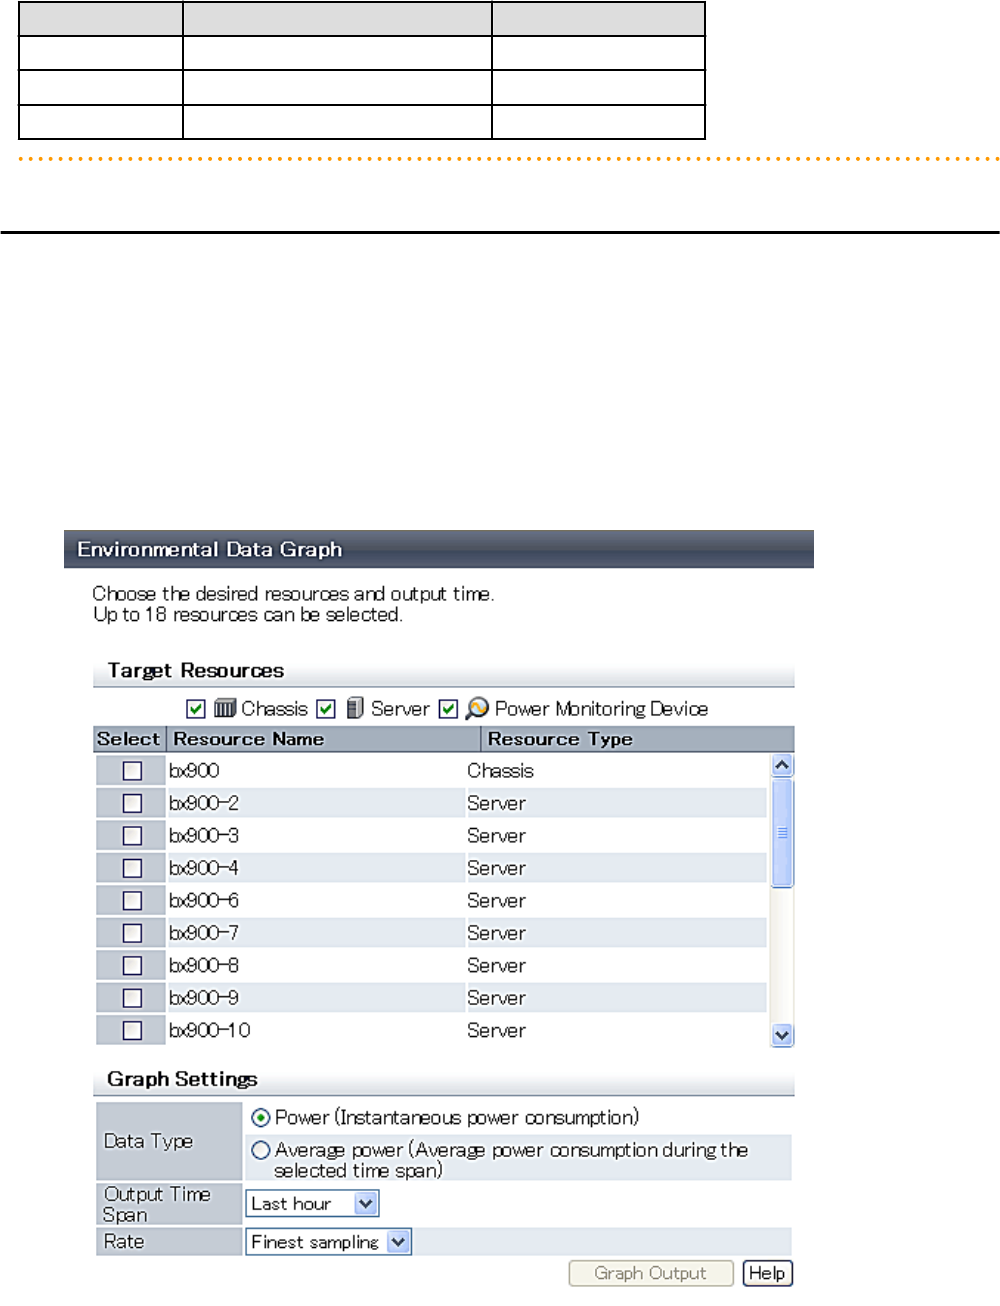
2. Set the following items:
Figure 13.2 [Environmental Data Graph] dialog
- 133 -