93
Unobserved Variables
Viewing the Graphics Output
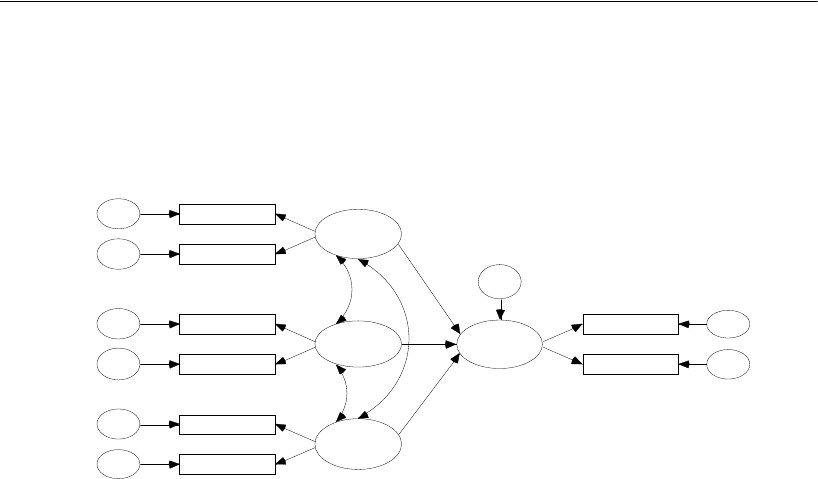
The path diagram with standardized parameter estimates displayed is as follows:
The value above performance indicates that pure knowledge, value, and satisfaction
account for 66% of the variance of performance. The values displayed above the
observed variables are reliability estimates for the eight individual subtests. A formula
for the reliability of the original tests (before they were split in half) can be found in
Rock et al. (1977) or any book on mental test theory.
Model B
Assuming that Model A is correct (and there is no evidence to the contrary), consider
the additional hypothesis that 1knowledge and 2knowledge are parallel tests. Under the
parallel tests hypothesis, the regression of 1knowledge on knowledge should be the
same as the regression of 2knowledge on knowledge. Furthermore, the error variables
associated with 1knowledge and 2knowledge should have identical variances. Similar
consequences flow from the assumption that 1value and 2value are parallel tests, as
well as 1performance and 2performance. But it is not altogether reasonable to assume
that 1satisfaction and 2satisfaction are parallel. One of the subtests is slightly longer
than the other because the original test had an odd number of items and could not be
.53
1knowledge
.38
2knowledge
.56
1value
.40
2value
.80
1satisfaction
.56
2satisfaction
.73
1performance
.67
2performance
knowledge
value
satisfaction
.66
performance
error1
error2
error8
error7
error6
error5
error4
error3
.75
.90
.63
.75
.62
.73
.52
.13
.40
.
5
4
-
.
0
8
.86
.82
error9
Example 5: Model A
Regression with unobserved variables
Job performance of farm managers
Warren, White and Fuller (1974)
Standardized estimates
Chi-square = 10.335 (14 df)
p = .737
.
0
6
