369
Multiple-Group Factor Analysis
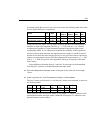
Here is the CMIN table:
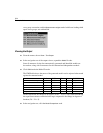
E In the navigation tree, click AIC under the Model Fit node.
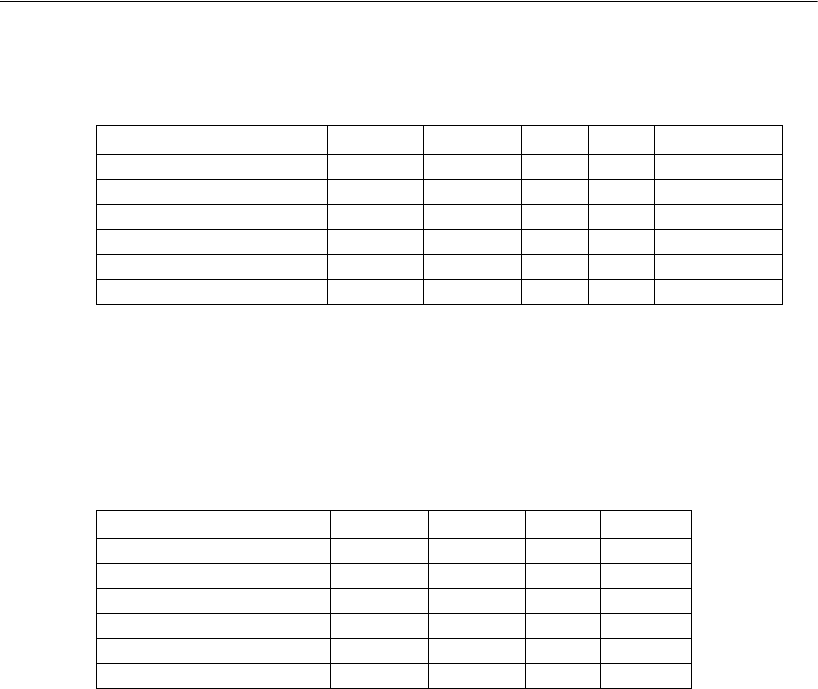
AIC and BCC values indicate that the best trade-off of model fit and parsimony is
obtained by constraining all parameters to be equal across groups (the Measurement
residuals model).
Here is the AIC table:
Customizing the Analysis
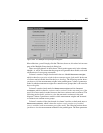
There were two opportunities to override the automatically generated cross-group
constraints. In Figure 24-2 on p. 365, you could have changed the check marks in
columns 1, 2, and 3, and you could have generated additional models by placing check
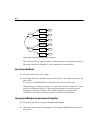
marks in columns 4 through 8. Then, in Figure 24-3 on p. 367, you could have renamed
or modified any of the automatically generated models listed in the panel at the left of
the path diagram.
Model NPAR CMIN DF P CMIN/DF
Unconstrained 26 16.48 16 0.42 1.03
Measurement weights 22 18.29 20 0.57 0.91
Structural covariances 19 22.04 23 0.52 0.96
Measurement residuals 13 26.02 29 0.62 0.90
Saturated model 42 0.00 0
Independence model 12 337.55 30 0.00 11.25
Model AIC BCC BIC CAIC
Unconstrained 68.48 74.12
Measurement weights 62.29 67.07
Structural covariances 60.04 64.16
Measurement residuals 52.02 54.84
Saturated model 84.00 93.12
Independence model 361.55 364.16


