580
Example 37
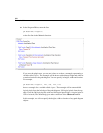
E In the Program Editor, enter the line
pd.Observed("visperc")
as the first line in the Mainsub function.
If you save the plugin now, you can use it later on to draw a rectangle representing a
variable called visperc. The rectangle will be drawn with arbitrary height and width at
a random location in the path diagram. You can specify its height, width and location.
For example,
pd.Observed("visperc", 400, 300, 200, 100)
draws a rectangle for a variable called visperc. The rectangle will be centered 400
logical pixels from the left edge of the path diagram, 300 logical pixels from the top
edge. It will be 200 logical pixels wide and 100 logical pixels high. (A logical pixel is
1/96 of an inch.) The online help gives other variations of the Observed method.
In this example, we will not specify the height, width or location of any path diagram
objects.


