107
Exploratory Analysis
The theoretical reasons for suspecting that eps1 and eps3 might be correlated apply
to eps2 and eps4 as well. The modification indices also suggest allowing eps2 and eps4
to be correlated. However, we will ignore this potential modification and proceed
immediately to look at the results of modifying Model A by allowing eps1 and eps3 to
be correlated. The new model is Jöreskog and Sörbom’s Model B.
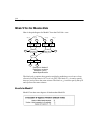
Model B for the Wheaton Data
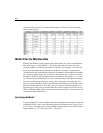
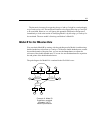
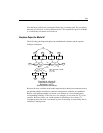
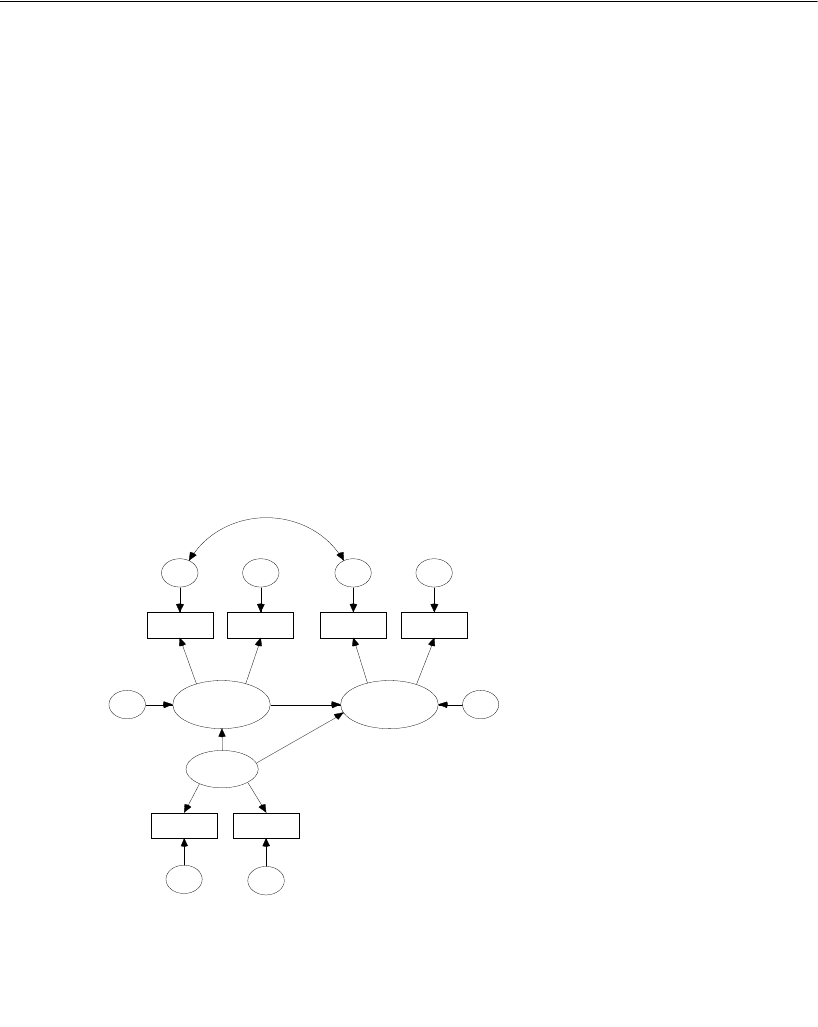
You can obtain Model B by starting with the path diagram for Model A and drawing a
double-headed arrow between eps1 and eps3. If the new double-headed arrow extends
beyond the bounds of the print area, you can use the
Shape button to adjust the
curvature of the double-headed arrow. You can also use the Move button to reposition
the end points of the double-headed arrow.
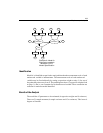
The path diagram for Model B is contained in the file Ex06-b.amw.
anomia67 powles67 anomia71 powles71
educatio SEI
67
alienation
71
alienation
eps1 eps2 eps3 eps4
ses
delta2
delta1
1 1 1 1
1
1
1
1
zeta2zeta1
1 1
1
Example 6: Model B
Exploratory analysis
Wheaton (1977)
Model Specification


