102
Example 6
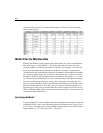
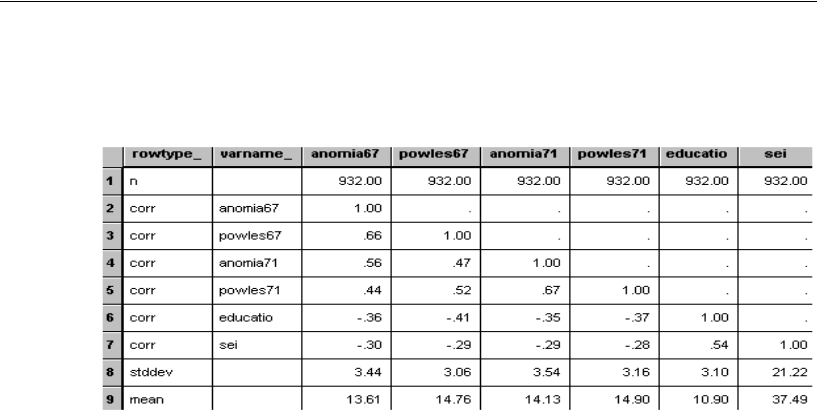
variances and covariances, as needed for the analysis. We will not use the sample
means in the analysis.
Model A for the Wheaton Data
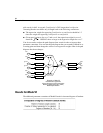
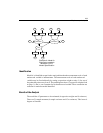
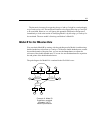
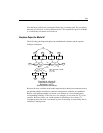
Jöreskog and Sörbom (1984) proposed the model shown on p. 103 for the Wheaton
data, referring to it as their Model A. The model asserts that all of the observed
variables depend on underlying, unobserved variables. For example, anomia67 and
powles67 both depend on the unobserved variable 67_alienation, a hypothetical
variable that Jöreskog and Sörbom referred to as alienation. The unobserved variables
eps1 and eps2 appear to play the same role as the variables error1 and error2 did in
Example 5. However, their interpretation here is different. In Example 5, error1 and
error2 had a natural interpretation as errors of measurement. In the present example,
since the anomia and powerlessness scales were not designed to measure the same
thing, it seems reasonable to believe that differences between them will be due to more
than just measurement error. So in this case, eps1 and eps2 should be thought of as
representing not only errors of measurement in anomia67 and powles67 but in every
other variable that might affect scores on the two tests besides 67_alienation (the one
variable that affects them both).
Specifying the Model
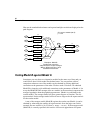
To specify Model A in Amos Graphics, draw the path diagram shown next, or open the
example file Ex06–a.amw. Notice that the eight unique variables (delta1, delta2, zeta1,
zeta2, and eps1 through eps4) are uncorrelated among themselves and with the three
latent variables: ses, 67_alienation, and 71_alienation.


