204
Example 12
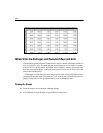
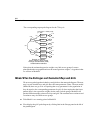
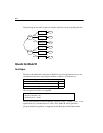
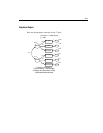
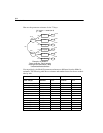
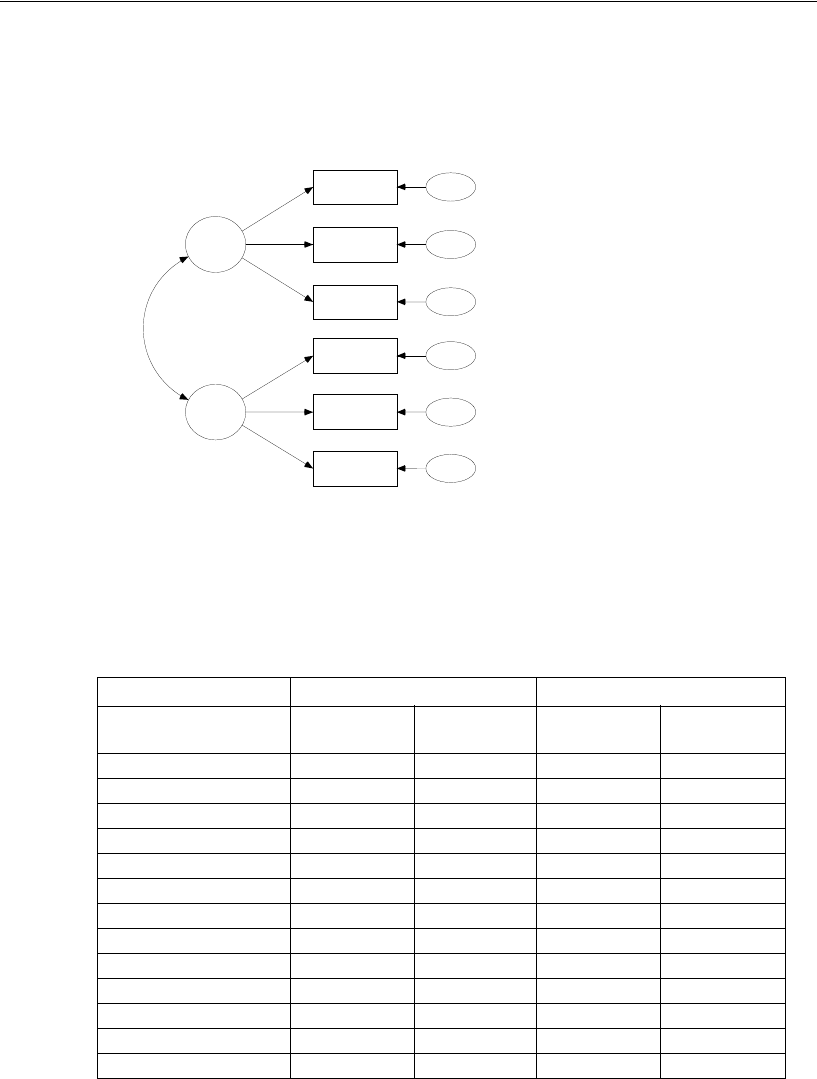
Here are the parameter estimates for the 72 boys:
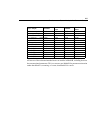
Not surprisingly, the Model B parameter estimates are different from the Model A
estimates. The following table shows estimates and standard errors for the two models
side by side:
Parameters Model A Model B
Girls’ sample Estimate
Standard
Error
Estimate
Standard
Error
g: cubes <--- spatial 0.610 0.143 0.557 0.114
g: lozenges <--- spatial 1.198 0.272 1.327 0.248
g: sentence <--- verbal 1.334 0.160 1.305 0.117
g: wordmean <--- verbal 2.234 0.263 2.260 0.200
g: spatial <---> verbal 7.315 2.571 7.225 2.458
g: var(spatial) 23.302 8.124 22.001 7.078
g: var(verbal) 9.682 2.159 9.723 2.025
g: var(err_v) 23.873 5.986 25.082 5.832
g: var(err_c) 11.602 2.584 12.382 2.481
g: var(err_l) 28.275 7.892 25.244 8.040
g: var(err_p) 2.834 0.869 2.835 0.834
g: var(err_s) 7.967 1.869 8.115 1.816
g: var(err_w) 19.925 4.951 19.550 4.837
16.18
spatial
visperc
cubes
lozenges
wordmean
paragrap
sentence
31.56
err_v
15.25
err_c
40.97
err_l
2.36
err_p
5.95
err_s
19.94
err_w
6.87
verbal
1.00
.56
1.33
1.00
1.31
2.26
1
1
1
1
1
1
7.00
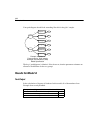
Example 12: Model B
Factor analysis: Boys' sample
Holzinger and Swineford (1939)
Unstandardized estimates
Chi-square = 18.292 (20 df)
p = .568


