511
Ordered-Categorical Data
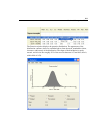
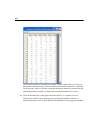
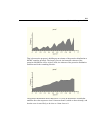
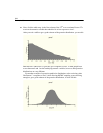
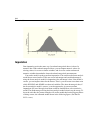
The mean of the posterior distribution (0.52) can be taken as an estimate of Person 1’s
score on the underlying variable if a point estimate is required. Looking at the plot of
the posterior distribution, we can be nearly 100% sure that the score is between –1 and
2. The score is probably between 0 and 1 because most of the area under the posterior
distribution lies between 0 and 1.
Posterior Predictive Distributions for Latent Variables
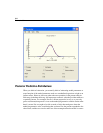
Suppose you want to estimate Person 1’s score on the WILLING factor. Amos can
estimate posterior predictive distributions for unknown scores only for observed
variables. It cannot estimate a posterior predictive distribution of a score on a latent
variable. However, there is a trick that you can use to estimate the posterior predictive
distribution of a score on WILLING. You can change WILLING to an observed
variable, treating it not as a latent variable but as an observed variable that has a
missing value for every case. That requires two changes – a change to the path diagram
and a change to the data.
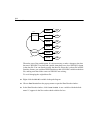
In the path diagram, the WILLING ellipse has to be changed into a rectangle. To
accomplish this:
E Right-click the WILLING ellipse and choose Toggle Observed/Unobserved from the pop-
up menu.
E Click the WILLING ellipse.
The WILLING ellipse changes to a rectangle so that the path diagram looks like this:


