115
Exploratory Analysis
Testing Model C
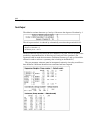
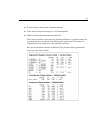
As expected, Model C has an acceptable fit, with a higher probability level than Model B:
You can test Model C against Model B by examining the difference in chi-square
values ( ) and the difference in degrees of freedom ( ).
A chi-square value of 1.118 with 3 degrees of freedom is not significant.
Parameter Estimates for Model C
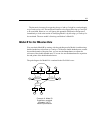
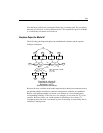
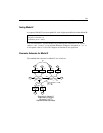
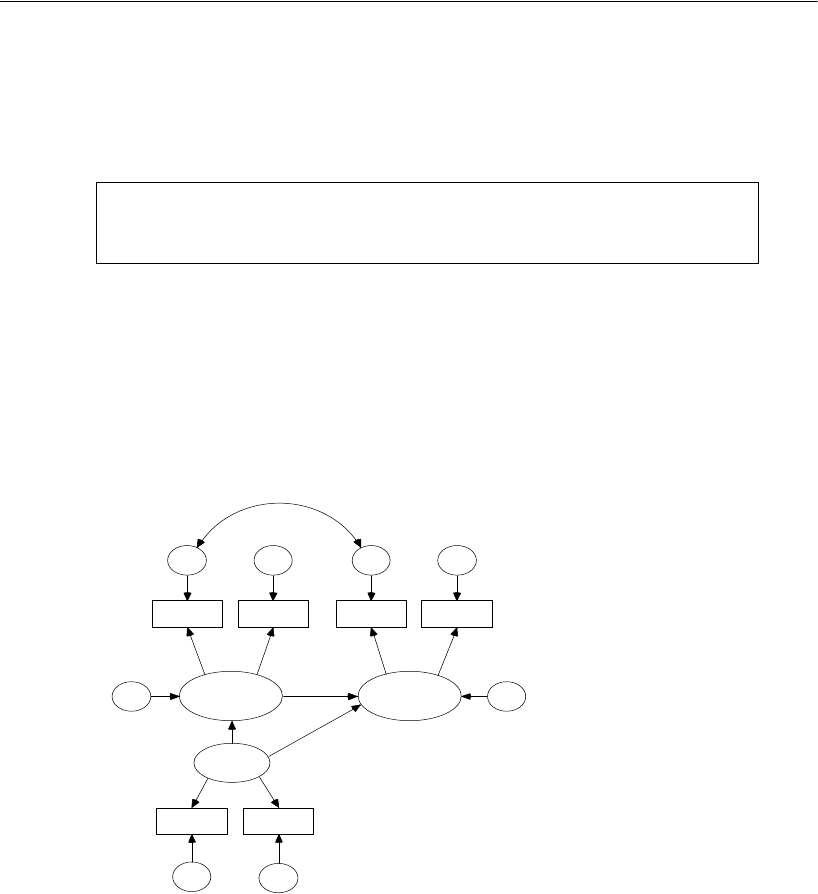
The standardized estimates for Model C are as follows:
Chi-square = 7.501
Degrees of freedom = 8
Probability level = 0.484
7.501 6.383 1.118=–
85 3=–
.58
anomia67
.74
powles67
.60
anomia71
.76
powles71
.71
educatio
.41
SEI
.31
67
alienation
.50
71
alienation
eps1 eps2 eps3 eps4
ses
delta2
delta1
.87.78
.86
.76
.85
.64
.58
-.19
-.56
zeta2zeta1
Example 6: Model C
Exploratory analysis
Wheaton (1977)
Standardized estimates
Chi-square = 7.50
df = 8
p = .48
.38


