96
Example 5
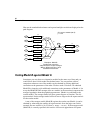
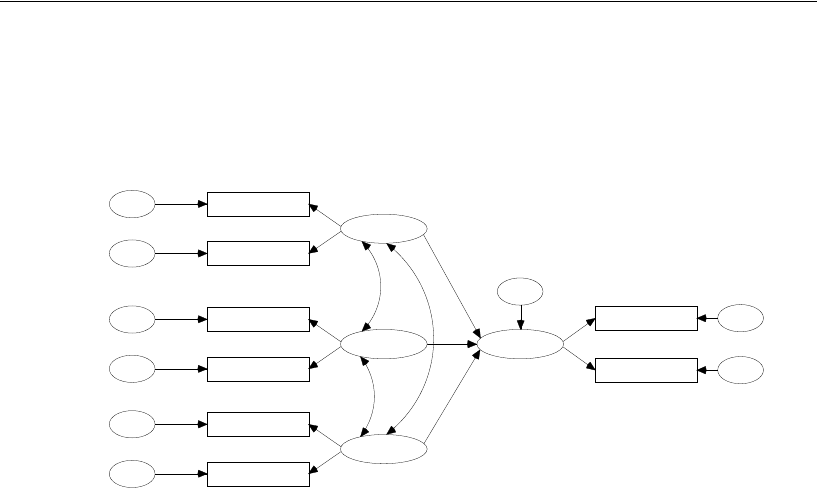
Here are the standardized estimates and squared multiple correlations displayed on the
path diagram:
Testing Model B against Model A
Sometimes you may have two alternative models for the same set of data, and you
would like to know which model fits the data better. You can perform a direct
comparison whenever one of the models can be obtained by placing additional
constraints on the parameters of the other. We have such a case here. We obtained
Model B by imposing eight additional constraints on the parameters of Model A. Let
us say that Model B is the stronger of the two models, in the sense that it represents the
stronger hypothesis about the population parameters. (Model A would then be the
weaker model). The stronger model will have greater degrees of freedom. The chi-
square statistic for the stronger model will be at least as large as the chi-square statistic
for the weaker model.
A test of the stronger model (Model B) against the weaker one (Model A) can be
obtained by subtracting the smaller chi-square statistic from the larger one. In this
example, the new statistic is 16.632 (that is, ). If the stronger model
(Model B) is correctly specified, this statistic will have an approximate chi-square
.44
1knowledge
.44
2knowledge
.47
1value
.47
2value
.62
1satisfaction
.67
2satisfaction
.70
1performance
.70
2performance
knowledge
value
satisfaction
.67
performance
error1
error2
error8
error7
error6
error5
error4
error3
.58
.82
.79
.69
.69
.66
.66
.53
.11
.38
.84
.84
error9
Example 5: Model B
Parallel tests regression
Job performance of farm managers
Warren, White and Fuller (1974)
Standardized estimates
Chi-square = 26.967 (22 df)
p = .212
-
.
0
8
.
5
7
.
0
9
26.967 10.335–


