334
Example 22
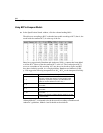
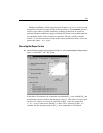
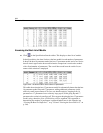
E Choose one of the models from the pop-up menu to see that model highlighted in the
table of model fit statistics and, at the same time, to see the path diagram of that model
in the drawing area.
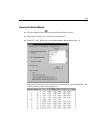
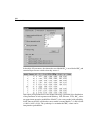
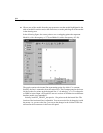
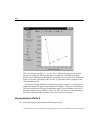
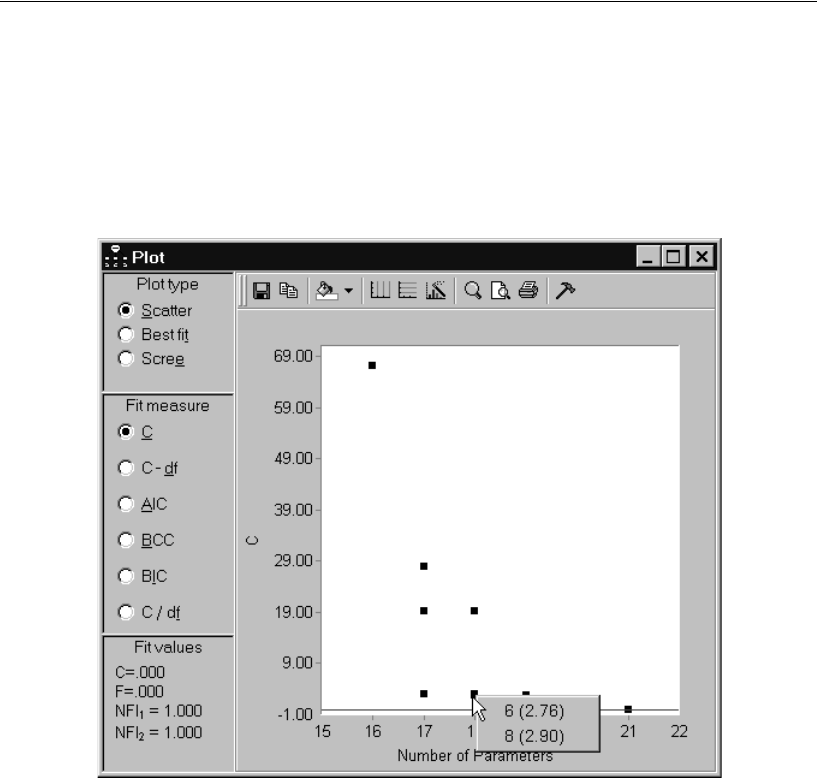
In the following figure, the cursor points to two overlapping points that represent
Model 6 (with a discrepancy of 2.76) and Model 8 (with a discrepancy of 2.90).
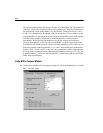
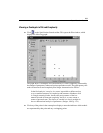
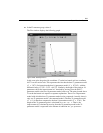
The graph contains a horizontal line representing points for which C is constant.
Initially, the line is centered at 0 on the vertical axis. The
Fit values panel at the lower
left shows that, for points on the horizontal line, C = 0 and also F = 0. (F is referred to
as FMIN in Amos output.) NFI
1
and NFI
2
are two versions of NFI that use two different
baseline models (see Appendix F).
Initially, both NFI
1
and NFI
2
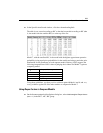
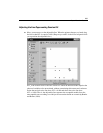
are equal to 1 for points on the horizontal line. The
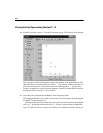
location of the horizontal line is adjustable. You can move the line by dragging it with
the mouse. As you move the line, you can see the changes in the location of the line
reflected in the fit measures in the lower left panel.


