404
Example 26
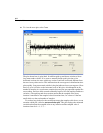
when the missing values fall in a peculiar pattern, or in models with some parameters
that are poorly estimated. If this should happen, the trace plots for one or more
parameters in the model will have long-term drifts or trends that do not diminish as
more and more samples are taken. Even as the trace plot gets squeezed together like an
accordion, the drifts and trends will not go away. In that case, you will probably see
that the range of sampled values for the parameter (as indicated by the vertical scale of
the trace plot, or by the S.D. or the difference between Min and Max in the Bayesian
SEM window) is huge. The autocorrelations may remain high for large lags or may
appear to oscillate between positive and negative values for a long time. When this
happens, it suggests that the model is too complicated to be supported by the data at
hand, and we ought to consider either fitting a simpler model or introducing
information about the parameters by specifying a more informative prior distribution.
Bivariate Marginal Posterior Plots
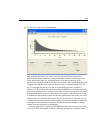
The summary table in the Bayesian SEM window and the frequency polygon in each
Posterior dialog box describe the marginal posterior distributions of the estimands, one
at a time. The marginal posterior distributions are very important, but they do not reveal
relationships that may exist among the estimands. For example, two covariances or
regression coefficients may share significance in the sense that either one could
plausibly be 0, but both cannot. To help us visualize the relationships among pairs of
estimands, Amos provides bivariate marginal posterior plots.
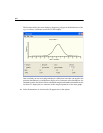
E To display the marginal posterior of two parameters, begin by displaying the posterior
distribution of one of the parameters (for example, the variance of age).
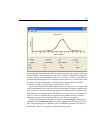
E Hold down the control (Ctrl) key on the keyboard and select the second parameter in
the summary table (for example, the variance of vocabulary).
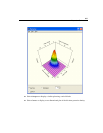
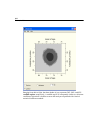
Amos then displays a three-dimensional surface plot of the marginal posterior
distribution of the variances of age and vocabulary.


