502
Example 33
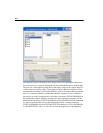
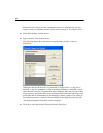
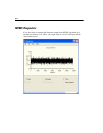
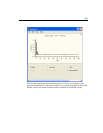
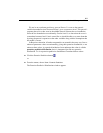
After the Bayesian SEM window opens, wait until the unhappy face changes into a
happy face. The Bayesian SEM window should then look something like this:
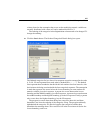
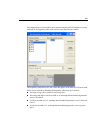
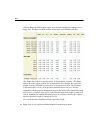
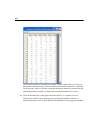
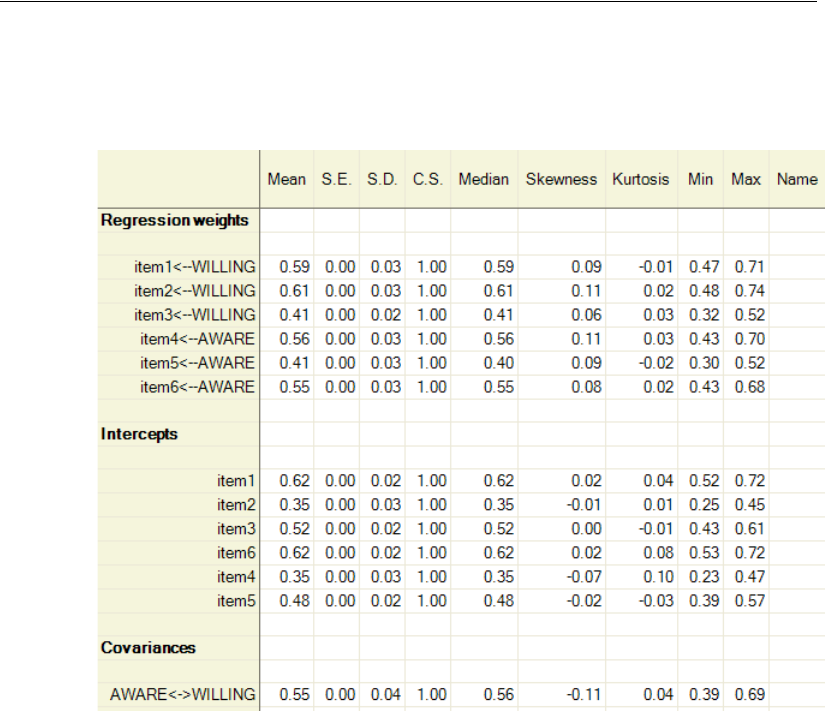
(The figure above shows some, but not all, of the parameter estimates.) The
Mean
column provides a point estimate for each parameter. For example, the regression
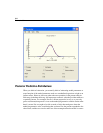
weight for using WILLING to predict item1 is estimated to be 0.59. The skewness
(0.09) and kurtosis (–0.01) of the posterior distribution are close to 0, which is
compatible with the posterior distribution being nearly normal. The standard deviation
(
S.D.) is 0.03, so there is about a 67% chance that the regression weight is within 0.03
of 0.59. Doubling the standard deviation gives 0.06, so there is about a 95% chance
that the regression weight is within 0.06 of 0.59.
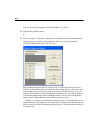
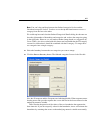
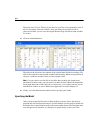
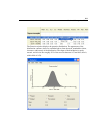
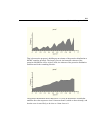
To view the posterior distribution of the regression weight:
E Right-click its row and choose Show Posterior from the pop-up menu.


