599
Measures of Fit
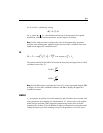
where p is the number of sample moments and q is the number of distinct parameters.
Rigdon (1994a) gives a detailed explanation of the calculation and interpretation of
degrees of freedom.
Note: Use the \df text macro to display the degrees of freedom in the output path
diagram.
PRATIO
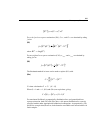
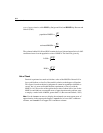
The parsimony ratio (James, Mulaik, and Brett, 1982; Mulaik, et al., 1989) expresses
the number of constraints in the model being evaluated as a fraction of the number of
constraints in the independence model
where d is the degrees of freedom of the model being evaluated and is the degrees
of freedom of the independence model. The parsimony ratio is used in the calculation
of PNFI and PCFI (see “Parsimony Adjusted Measures” on p. 612).
Note: Use the \pratio text macro to display the parsimony ratio in the output path
diagram.
Minimum Sample Discrepancy Function
The following fit measures are based on the minimum value of the discrepancy.
CMIN
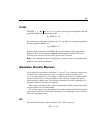
CMIN is the minimum value, , of the discrepancy, C (see Appendix B).
Note: Use the \cmin text macro to display the minimum value of the discrepancy
function C in the output path diagram.
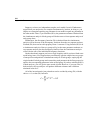
P
P is the probability of getting as large a discrepancy as occurred with the present
sample (under appropriate distributional assumptions and assuming a correctly
i
d
d
=PRATIO
d
i
C
ˆ
C
ˆ


