


179
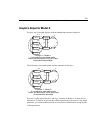
Felson and Bohrnstedt’s Girls and Boys
Text Output for Model A
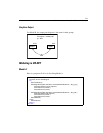
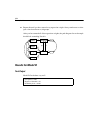
With two groups instead of one (as in Example 7), there are twice as many sample
moments and twice as many parameters to estimate. Therefore, you have twice as
many degrees of freedom as there were in Example 7.
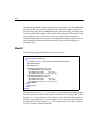
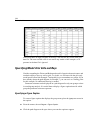
The model fits the data from both groups quite well.
We accept the hypothesis that the Felson and Bohrnstedt model is correct for both boys
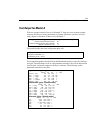
and girls. The next thing to look at is the parameter estimates. We will be interested in
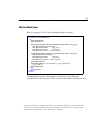
how the girls’ estimates compare to the boys’ estimates. The following are the
parameter estimates for the girls:
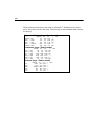
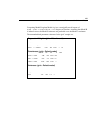
Chi-square = 3.183
Degrees of freedom = 4
Probability level = 0.528
Computation of degrees of freedom (Default model)
Number of distinct sample moments: 42
Number of distinct parameters to be estimated: 38
Degrees of freedom (42 - 38): 4
Regression Weights: (girls - Default model)
Estimate S.E. C.R. P Label
academic
<---
GPA .023 .004 6.241 ***
attract <---
height .000 .010 .050 .960
attract <---
weight -.002 .001 -1.321 .186
attract <---
rating .176 .027 6.444 ***
attract <---
academic
1.607 .350 4.599 ***
academic
<---
attract -.002 .051 -.039 .969
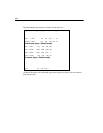
Covariances: (girls - Default model)
Estimate S.E. C.R. P Label
GPA <-->
rating
.526 .246 2.139 .032
height
<-->
rating
-.468 .205 -2.279 .023
GPA <-->
weight
-6.710 4.676 -1.435 .151
GPA <-->
height
1.819 .712 2.555 .011
height
<-->
weight
19.024 4.098 4.642 ***
weight
<-->
rating
-5.243 1.395 -3.759 ***
error1
<-->
error2
-.004 .010 -.382 .702
Variances: (girls - Default model)
Estimate S.E. C.R. P Label
GPA
12.122 1.189 10.198 ***
height
8.428 .826 10.198 ***
weight
371.476 36.427 10.198 ***
rating
1.015 .100 10.198 ***
error1
.019 .003 5.747 ***
error2
.143 .014 9.974 ***