249
Sörbom’s Alternative to Analysis of Covariance
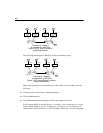
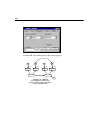
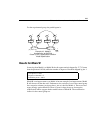
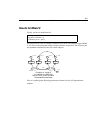
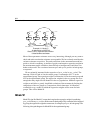
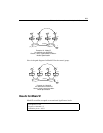
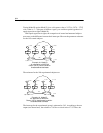
For the experimental group, the path diagram is:
Results for Model B
In moving from Model A to Model B, the chi-square statistic dropped by 17.712 (more
than the promised 10.508) while the number of degrees of freedom dropped by just 1.
Model B is an improvement over Model A but not enough of an improvement. Model
B still does not fit the data well. Furthermore, the variance of zeta in the control group
has a negative estimate (not shown here), just as it had for Model A. These two facts
argue strongly against Model B. There is room for hope, however, because the
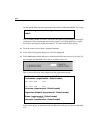
modification indices suggest further modifications of Model B. The modification
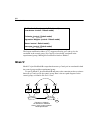
indices for the control group are:
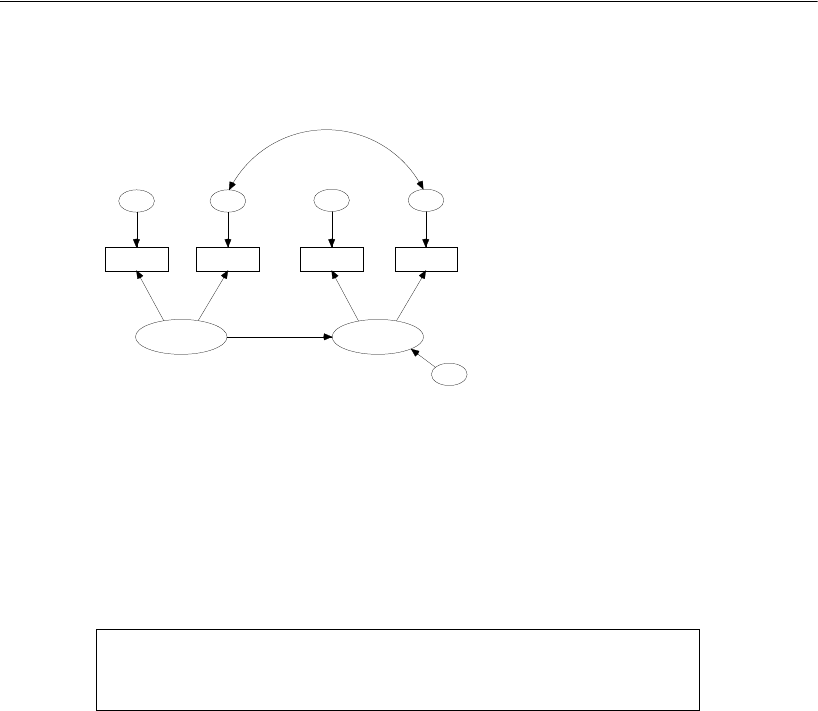
Chi-square = 17.063
Degrees of freedom = 5
Probability level = 0.004
pre_diff,
pre_verbal
a_syn1
pre_syn
0,
eps1
1
1
a_opp1
pre_opp
0,
eps2
opp_v1
1
effect
post_verbal
a_syn2
post_syn
0,
eps3
a_opp2
post_opp
0,
eps4
1
1
opp_v2
1
0,
zeta
1
Example 16: Model B
An alternative to ANCOVA
Olsson (1973): experimental condition.
Model Specification


