605
Measures of Fit
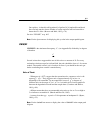
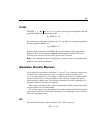
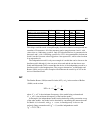
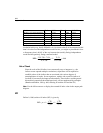
PCLOSE
is a p value for testing the null hypothesis that the
population RMSEA is no greater than 0.05.
By contrast, the p value in the P column (see “P” on p. 599) is for testing the hypothesis
that the population RMSEA is 0.
Based on their experience with RMSEA, Browne and Cudeck (1993) suggest that a
RMSEA of 0.05 or less indicates a close fit. Employing this definition of close fit,
PCLOSE gives a test of close fit while P gives a test of exact fit.
Note: Use the \pclose text macro to display the p value for close fit of the population
RMSEA in the output path diagram.
Information-Theoretic Measures
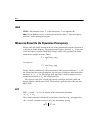
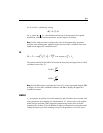
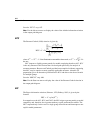
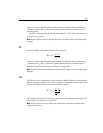
Amos reports several statistics of the form or , where k is some positive
constant. Each of these statistics creates a composite measure of badness of fit
( or ) and complexity (q) by forming a weighted sum of the two. Simple models
that fit well receive low scores according to such a criterion. Complicated, poorly
fitting models get high scores. The constant k determines the relative penalties to be
attached to badness of fit and to complexity.
The statistics described in this section are intended for model comparisons and not
for the evaluation of an isolated model.
All of these statistics were developed for use with maximum likelihood estimation.
Amos reports them for GLS and ADF estimation as well, although it is not clear that
their use is appropriate there.
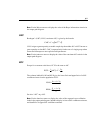
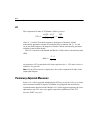
AIC
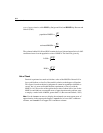
The Akaike information criterion (Akaike, 1973, 1987) is given by
PCLOSE 1 Φ C
ˆ
.05
2
nd d,()–=
05.RMSEA :
0
≤
H
0RMSEA :
0
=H
C
ˆ
kq+
F
ˆ
kq+
C
ˆ
F
ˆ
qC 2
ˆ
AIC +=


