570
Example 36
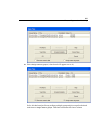
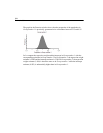
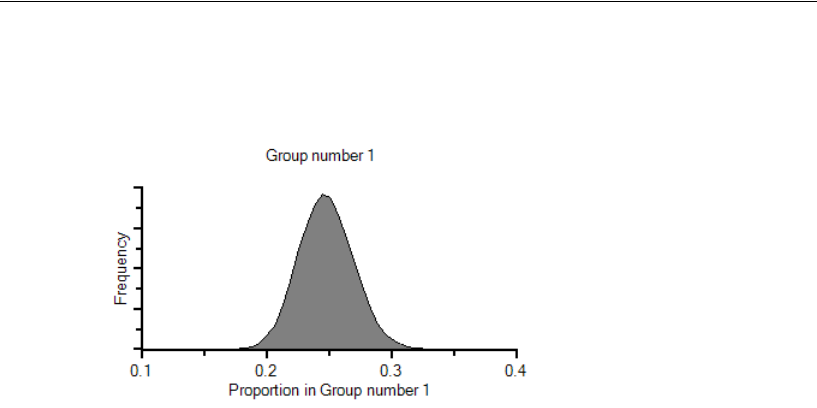
The graph in the Posterior window shows that the proportion of the population in
Group number 1 is practically guaranteed to be somewhere between 0.15 and 0.35.
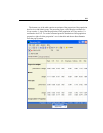
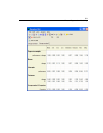
Let’s compare the regression weight and the intercept in Group number 1 with the
corresponding estimates in Group number 2. In Group number 1, the regression weight
estimate is 2.082 and the intercept estimate is 5.399. In Group number 2, the regression
weight estimate (1.999) is about the same as in Group number 1 while the intercept
estimate (9.955) is substantially higher than in Group number 1.


