181
Felson and Bohrnstedt’s Girls and Boys
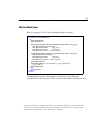
Graphics Output for Model A
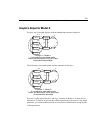
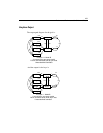
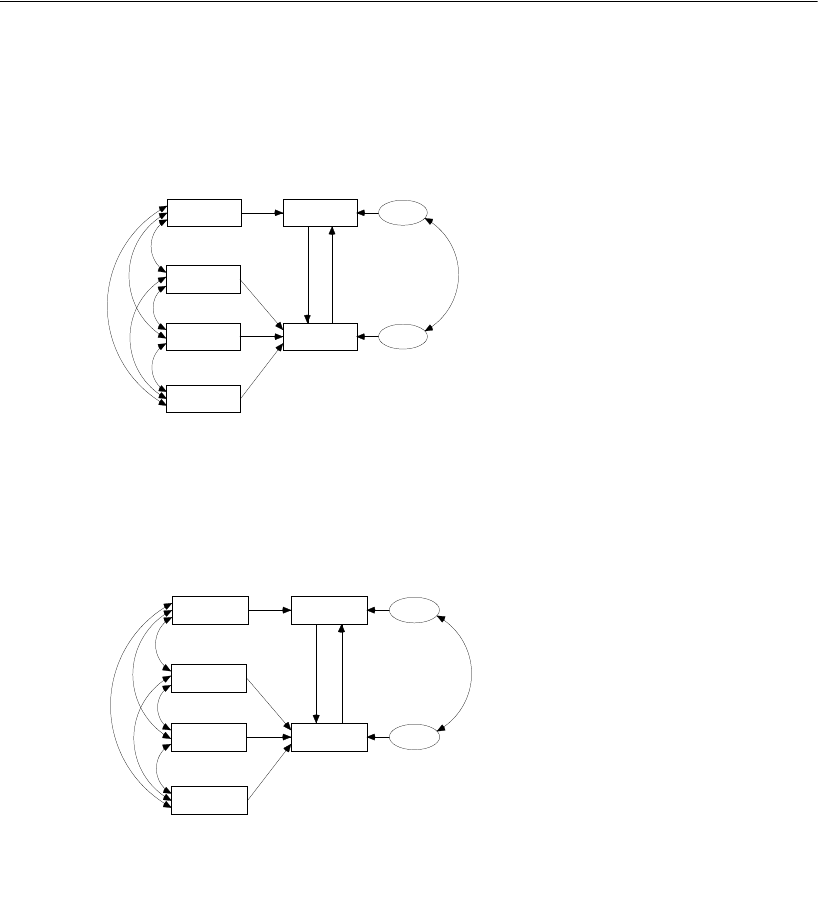
For girls, this is the path diagram with unstandardized estimates displayed:
The following is the path diagram with the estimates for the boys:
You can visually inspect the girls’ and boys’ estimates in Model A, looking for sex
differences. To find out if girls and boys differ significantly with respect to any single
parameter, you could examine the table of critical ratios of differences among all pairs
of free parameters.
12.12
GPA
8.43
height
1.02
rating
371.48
weight
academic
attract
.02
.
0
0
.00
.
1
8
.02
error1
.14
error2
1
1
.
5
3
-
.
4
7
-
6
.
7
1
1
.
8
2
1
9
.
0
2
-
5
.
2
4
1.61
.00
.00
Example 11: Model A
A nonrecursive, two-group model
Felson and Bohrnstedt (1979) girls' data
Unstandardized estimates
16.24
GPA
11.57
height
.94
rating
588.61
weight
academic
attract
.02
.
02
.00
.
1
0
.01
error1
.16
error2
1
1
.
5
1
.
2
0
-
1
5
.
6
4
-
1
.
5
1
4
2
.
0
9
-
4
.
2
3
1.39
.06
-.01
Example 11: Model A
A nonrecursive, two-group model
Felson and Bohrnstedt (1979) boys' data
Unstandardized estimates


