533
Mixture Modeling with Training Data
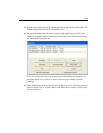
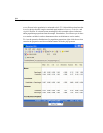
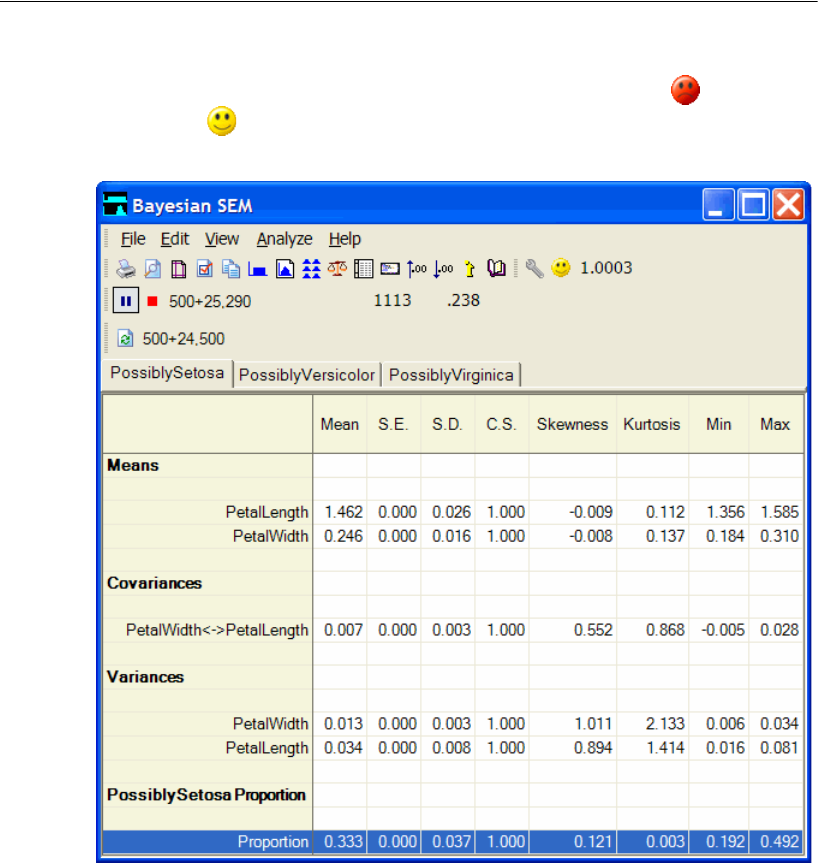
After the Bayesian SEM window opens, wait until the unhappy face changes into
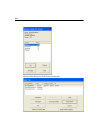
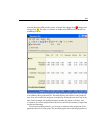
a happy face . The table of estimates in the Bayesian SEM window should look
something like this:
The Bayesian SEM window displays all of the parameter estimates that you would get
in an ordinary three-group analysis. The table displays the results for one group at a
time. You can switch from one group to another by clicking the tabs at the top of the
table. In this example, the model parameters include only means, variances, and
covariances. In a more complicated model, there would also be estimates of regression
weights and intercepts.
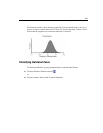
In a mixture modeling analysis, you also get an estimate of the proportion of the
population that lies in each group. The preceding figure shows that the proportion of


