261
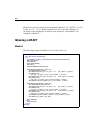
Sörbom’s Alternative to Analysis of Covariance
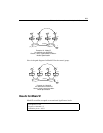
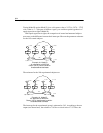
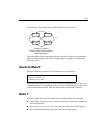
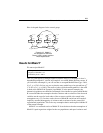
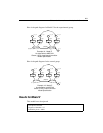
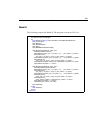
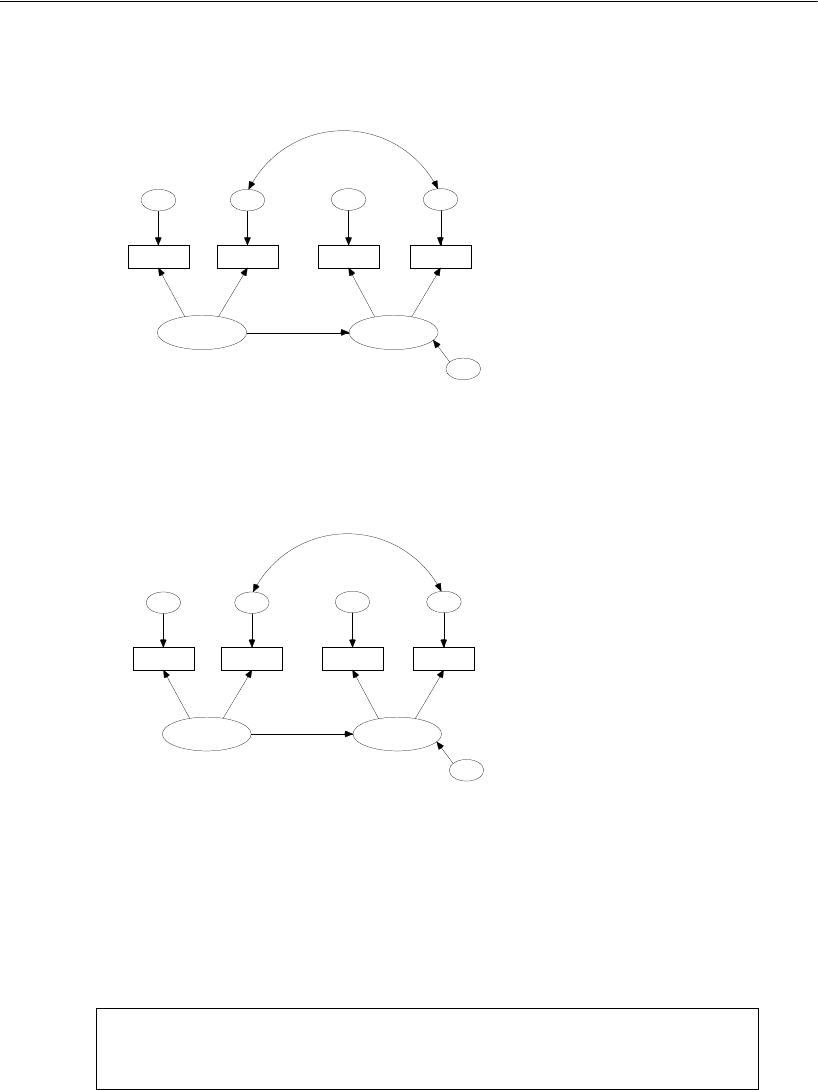
Here is the path diagram for Model Z for the experimental group:
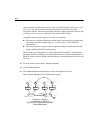
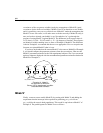
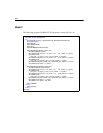
Here is the path diagram for the control group:
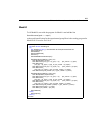
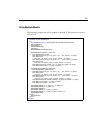
Results for Model Z
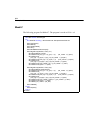
This model has to be rejected.
Chi-square = 84.280
Degrees of freedom = 13
Probability level = 0.000
pre_diff, v_v1
pre_verbal
a_syn1
pre_syn
0, v_e1
eps1
1
1
a_opp1
pre_opp
0, v_e2
eps2
opp_v1
1
0
post_verbal
a_syn2
post_syn
0, v_e3
eps3
a_opp2
post_opp
0, v_e4
eps4
1
1
opp_v2
1
pre2post
0, v_z
zeta
1
Example 16: Model Z
An alternative to ANCOVA
Olsson (1973): experimental condition.
Model Specification
c_e2e4
0, v_v1
pre_verbal
a_syn1
pre_syn
0, v_e1
eps1
1
1
a_opp1
pre_opp
0, v_e2
eps2
opp_v1
1
0
post_verbal
a_syn2
post_syn
0, v_e3
eps3
a_opp2
post_opp
0, v_e4
eps4
1
1
opp_v2
1
pre2post
0, v_z
zeta
1
Example 16: Model Z
An alternative to ANCOVA
Olsson (1973): control condition.
Model Specification
c_e2e4


