550
Example 35
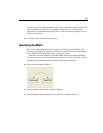
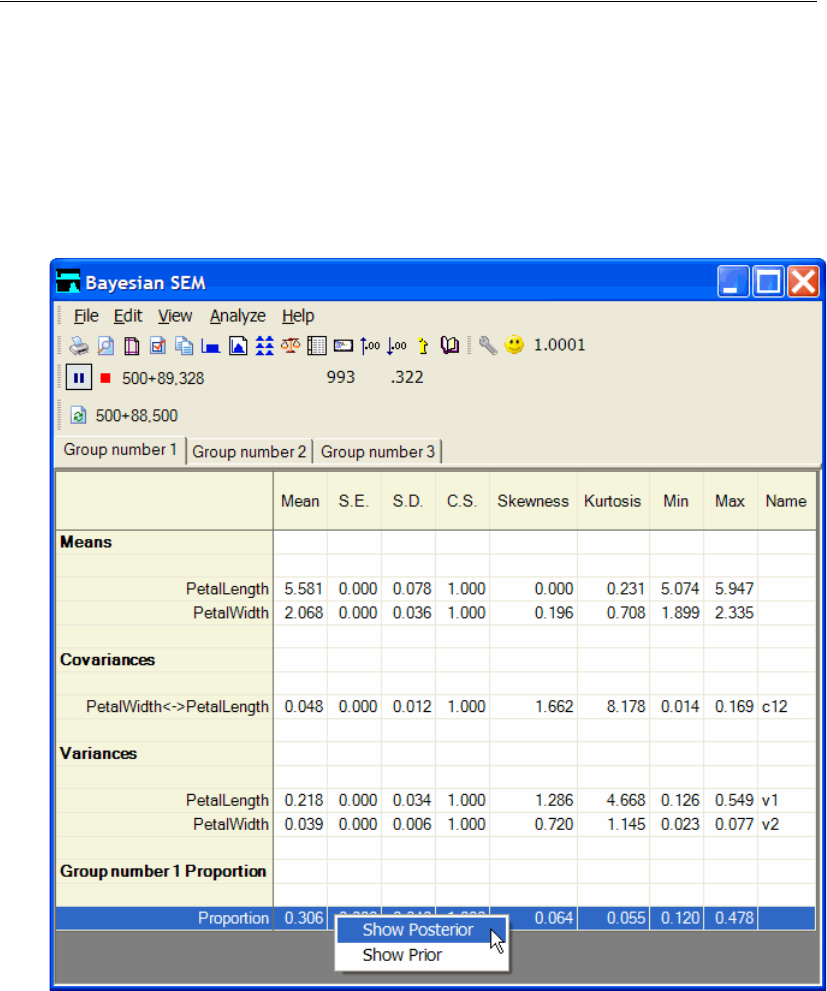
In a mixture modeling analysis, you also get an estimate of the proportion of the
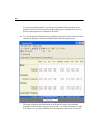
population that lies in each group. In the preceding figure, the proportion of setosa
flowers in the population is estimated to be 0.306.
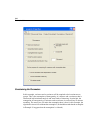
E To view the posterior distribution of a population proportion, right-click the row that
contains the proportion and choose
Show Posterior from the pop-up menu.
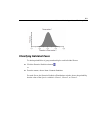
The graph of the posterior distribution in the Posterior window shows that the
proportion of flowers that belong in Group number 1 is certainly between 0.15 and
0.45. There is a very high probability that the proportion is between 0.25 and 0.35.


