


132
Example 7
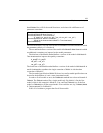
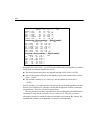
Judging by the critical ratios, you see that each of these three null hypotheses would be
accepted at conventional significance levels:
Perceived attractiveness does not depend on height (critical ratio = 0.050).
Perceived academic ability does not depend on perceived attractiveness (critical
ratio = –0.039).
The residual variables error1 and error2 are uncorrelated (critical ratio =
–0.382).
Strictly speaking, you cannot use the critical ratios to test all three hypotheses at once.
Instead, you would have to construct a model that incorporates all three constraints
simultaneously. This idea will not be pursued here.
The raw parameter estimates reported above are not affected by the identification
constraints (except for the variances of error1 and error2). They are, of course,
affected by the units in which the observed variables are measured. By contrast, the
standardized estimates are independent of all units of measurement.
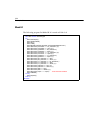
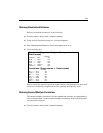
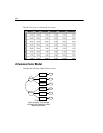
Regression Weights: (Group number 1 - Default model)
Estimate
S.E. C.R. P Label
academic
<---
GPA .023
.004 6.241 ***
attract <---
height .000
.010 .050 .960
attract <---
weight -.002
.001 -1.321 .186
attract <---
rating .176
.027 6.444 ***
attract <---
academic
1.607
.349 4.599 ***
academic
<---
attract -.002
.051 -.039 .969
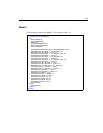
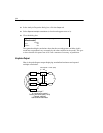
Covariances: (Group number 1 - Default model)
Estimate
S.E. C.R. P Label
GPA <-->
rating
.526
.246 2.139 .032
height
<-->
rating
-.468
.205 -2.279 .023
GPA <-->
weight
-6.710
4.676 -1.435 .151
GPA <-->
height
1.819
.712 2.555 .011
height
<-->
weight
19.024
4.098 4.643 ***
weight
<-->
rating
-5.243
1.395 -3.759 ***
error1
<-->
error2
-.004
.010 -.382 .702
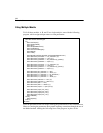
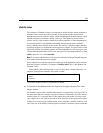
Variances: (Group number 1 - Default model)
Estimate
S.E.
C.R. P Label
GPA
12.122
1.189
10.198 ***
height
8.428
.826
10.198 ***
weight
371.476
36.426
10.198 ***
rating
1.015
.100
10.198 ***
error1
.019
.003
5.747 ***
error2
.143
.014
9.974 ***