494
Example 33
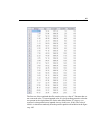
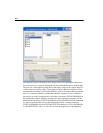
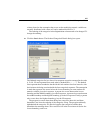
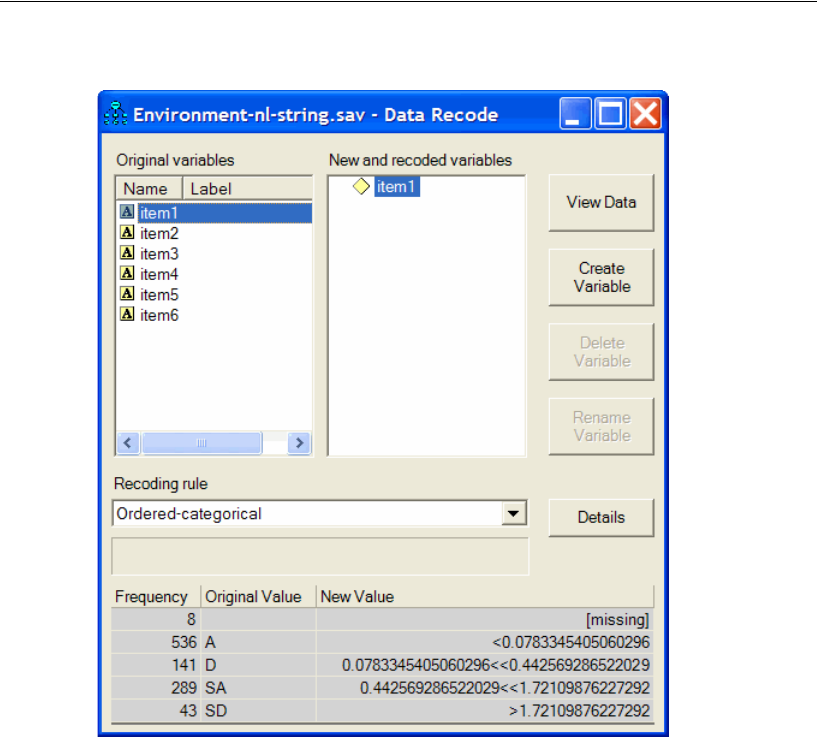
The frequency table at the bottom of the window now has a New Value column that
shows how the item1 values in the data file will be recoded before Amos reads the data.
The first row of the frequency table shows that empty strings in the original data file
will be treated as missing values. The second row shows that the A response will be
translated into the string <0.0783345405060296. Amos will interpret this to mean that
there is a continuous numeric variable that underlies responses to item1, and that a
person who gives the A response has a score that is less than 0.0783345405060296 on
that underlying variable. Similarly, the third row shows that the D response will be
translated into the string 0.0783345405060296<<0.442569286522029 and interpreted
by Amos to mean that the score on the underlying numeric variable is between
0.0783345405060296 and 0.442569286522029. The numbers, 0.0783345405060296,
0.442569286522029, and so on, are derived from the frequencies in the
Frequency


