459
Estimating a User-Defined Quantity in Bayesian SEM
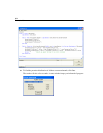
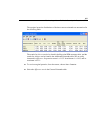
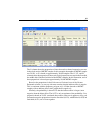
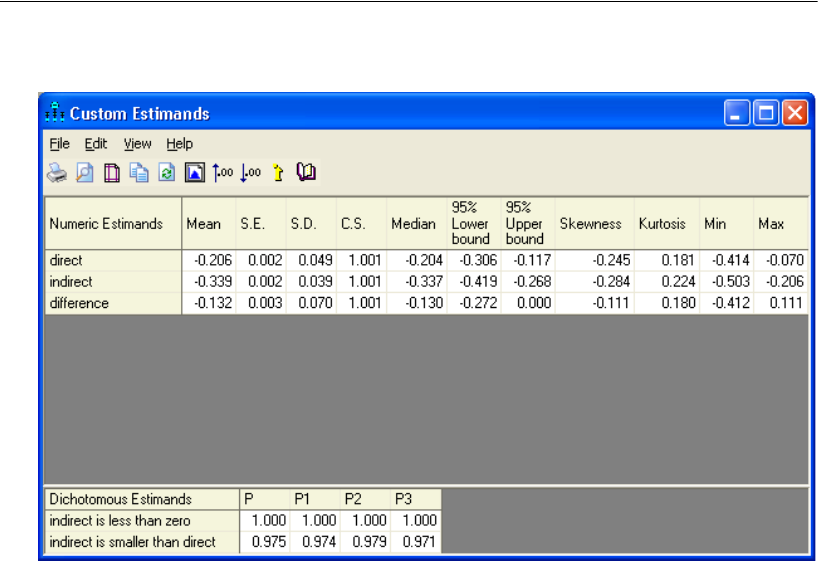
The P column shows the proportion of times that each evaluated expression was true
in the whole series of MCMC samples. In this example, the number of MCMC samples
was 29,501, so P is based on approximately 30,000 samples. The P1, P2, and P3
columns show the proportion of times each logical expression was true in the first third,
the middle third, and the final third of the MCMC samples. In this illustration, each of
these proportions is based upon approximately 10,000 MCMC samples.
Based on the proportions in the Dichotomous Estimands area of the Custom
Estimands window, we can say with near certainty that the indirect effect is negative.
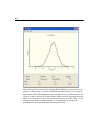
This is consistent with the frequency polygon on p. 442 that showed no MCMC
samples with an indirect effect value greater than or equal to 0.
Similarly, the probability is about 0.975 that the indirect effect is larger (more
negative) than the direct effect. The 0.975 is only an estimate of the probability. It is a
proportion based on 29,501 correlated observations. However it appears to be a good
estimate because the proportions from the first third (0.974), middle third (0.979) and
final third (0.971) are so close together.


