509
Ordered-Categorical Data
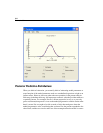
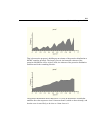
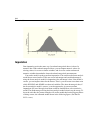
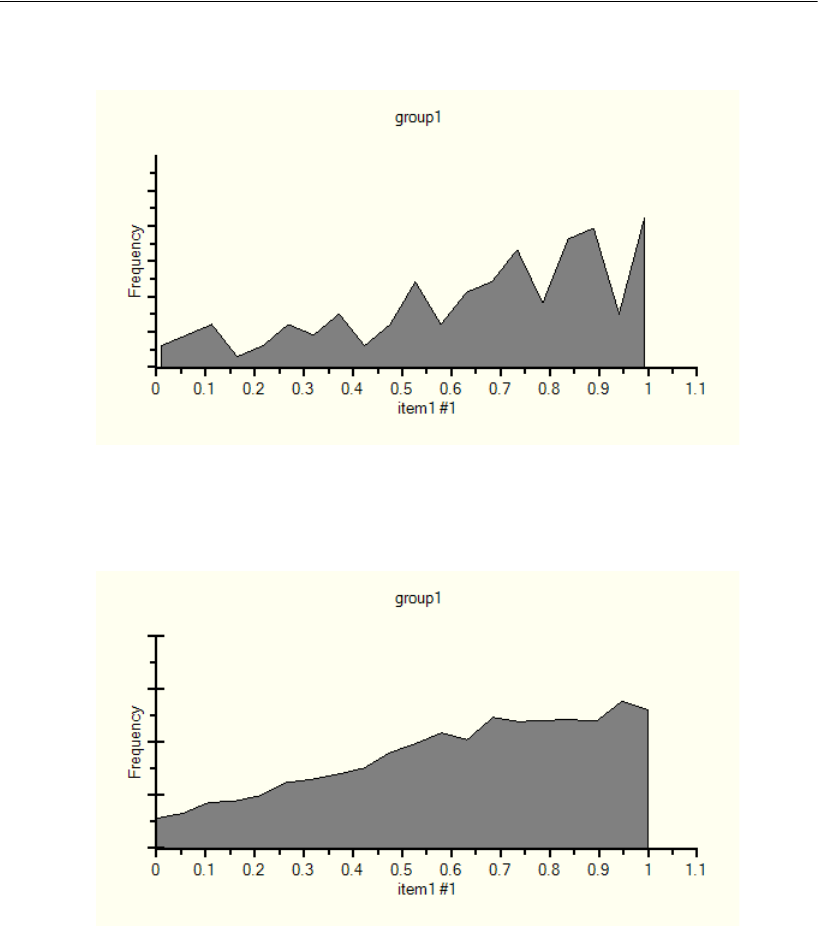
That is because the program is building up an estimate of the posterior distribution as
MCMC sampling proceeds. The longer you wait, the better the estimate of the
posterior distribution will be. After a while, the estimate of the posterior distribution
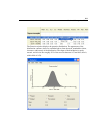
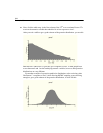
stabilizes and looks something like this:
The posterior distribution shows that Person 1’s score on the numeric variable that
underlies his or her response to item1 is between 0 and 1 (which we knew already), and
that the score is more likely to be close to 1 than close to 0.


