109
Exploratory Analysis
Note the large critical ratio associated with the new covariance path. The covariance
between eps1 and eps3 is clearly different from 0. This explains the poor fit of Model
A, in which that covariance was fixed at 0.
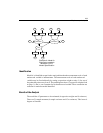
Graphics Output for Model B
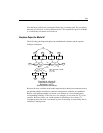
The following path diagram displays the standardized estimates and the squared
multiple correlations:
Because the error variables in the model represent more than just measurement error,
the squared multiple correlations cannot be interpreted as estimates of reliabilities.
Rather, each squared multiple correlation is an estimate of a lower bound on the
corresponding reliability. Take education, for example. Ses accounts for 72% of its
variance. Because of this, you would estimate its reliability to be at least 0.72.
Considering that education is measured in years of schooling, it seems likely that its
reliability is much greater.
.57
anomia67
.76
powles67
.62
anomia71
.73
powles71
.72
educatio
.41
SEI
.31
67
alienation
.50
71
alienation
eps1 eps2 eps3 eps4
ses
delta2
delta1
.86
.79
.87.76
.85
.64
.58
-.20
-.55
zeta2zeta1
Example 6: Model B
Exploratory analysis
Wheaton (1977)
Standardized estimates
Chi-square = 6.38
df = 5
p = .27
.38


