8
Chapter 2
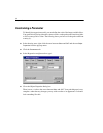
demonstrates the menu path. For information about the toolbar buttons and keyboard
shortcuts, see the online help.
About the Data
Hamilton (1990) provided several measurements on each of 21 states. Three of the
measurements will be used in this tutorial:
Average SAT score
Per capita income expressed in $1,000 units
Median education for residents 25 years of age or older
You can find the data in the Tutorial directory within the Excel 8.0 workbook
Hamilton.xls in the worksheet named Hamilton. The data are as follows:
SAT Income Education
899 14.345 12.7
896 16.37 12.6
897 13.537 12.5
889 12.552 12.5
823 11.441 12.2
857 12.757 12.7
860 11.799 12.4
890 10.683 12.5
889 14.112 12.5
888 14.573 12.6
925 13.144 12.6
869 15.281 12.5
896 14.121 12.5
827 10.758 12.2
908 11.583 12.7
885 12.343 12.4
887 12.729 12.3
790 10.075 12.1
868 12.636 12.4
904 10.689 12.6
888 13.065 12.4


