400
Example 26
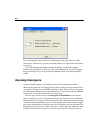
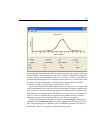
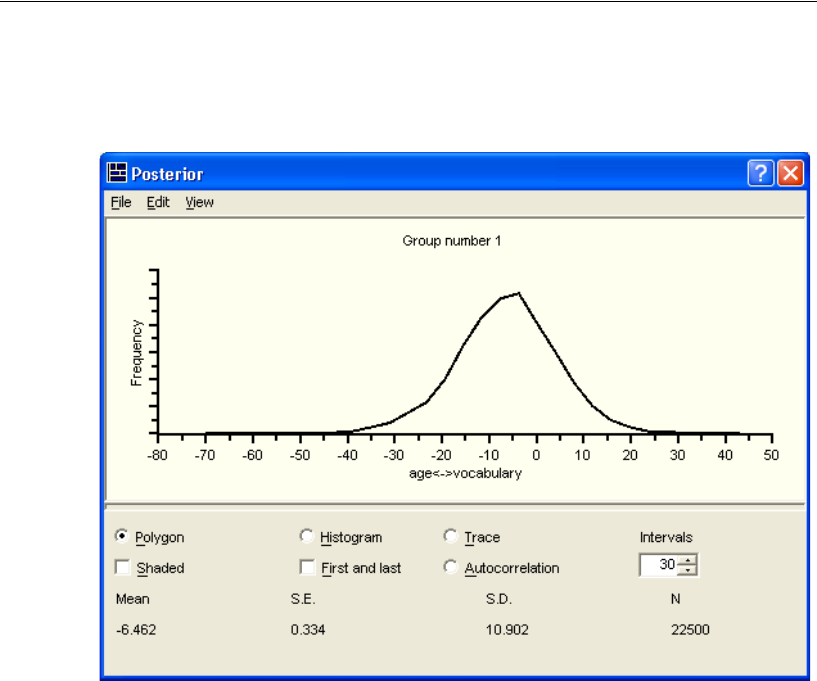
The Posterior dialog box now displays a frequency polygon of the distribution of the
age-vocabulary covariance across the 22,500 samples.
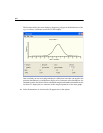
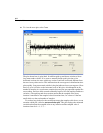
One visual aid you can use to judge whether it is likely that Amos has converged to the
posterior distribution is a simultaneous display of two estimates of the distribution, one
obtained from the first third of the accumulated samples and another obtained from the
last third. To display the two estimates of the marginal posterior on the same graph:
E Select First and last. (A check mark will appear next to the option.)


