187
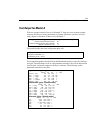
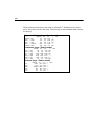
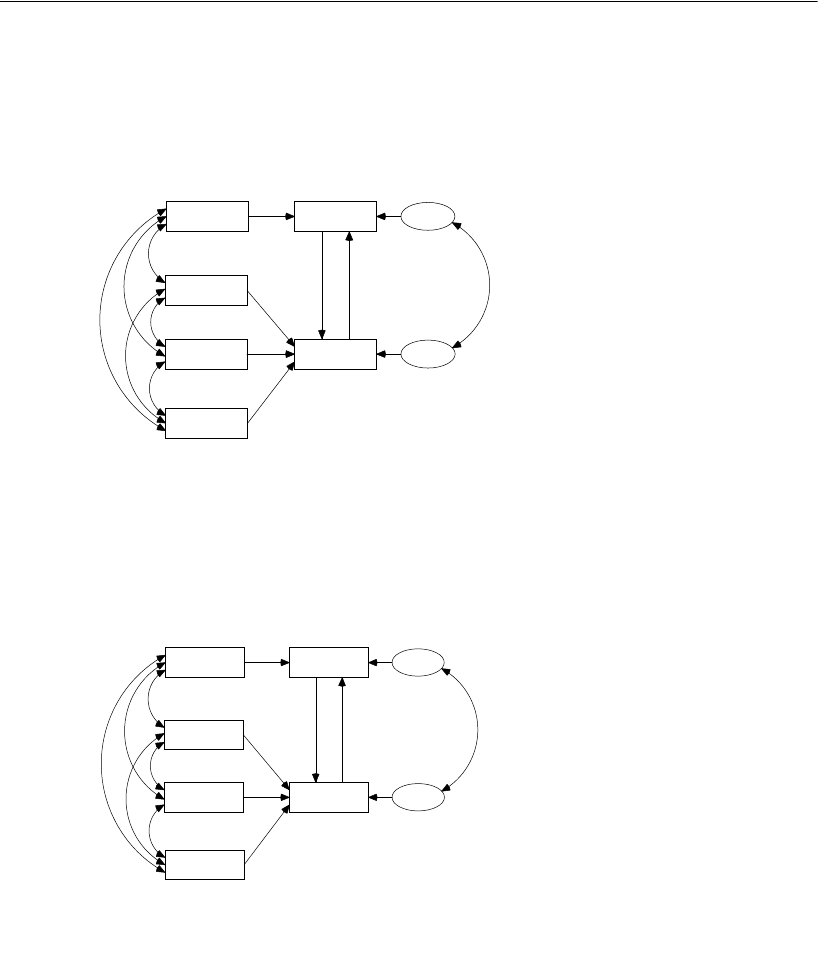
Felson and Bohrnstedt’s Girls and Boys
Graphics Output
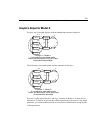
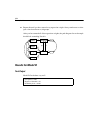
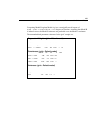
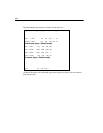
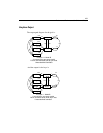
The output path diagram for the girls is:
And the output for the boys is:
12.12
GPA
8.43
height
1.02
rating
371.48
weight
academic
attract
.02
.
0
1
.00
.
1
5
.02
error1
.14
error2
1
1
.
5
3
-
.
4
7
-
6
.
7
1
1
.
8
2
1
9
.
0
2
-
5
.
2
4
1.45 .02
.00
Example 11: Model B
A nonrecursive, two-group model
Felson and Bohrnstedt (1979) girls' data
Unstandardized estimates
16.24
GPA
11.57
height
.94
rating
588.61
weight
academic
attract
.02
.
0
1
.00
.
1
5
.02
error1
.17
error2
1
1
.
5
1
.
2
0
-
1
5
.
6
4
-
1
.
5
1
4
2
.
0
9
-
4
.
2
3
1.45 .02
.00
Example 11: Model B
A nonrecursive, two-group model
Felson and Bohrnstedt (1979) boys' data
Unstandardized estimates


