


317
Bootstrapping to Compare Estimation Methods
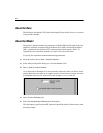
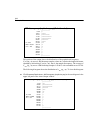
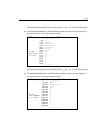
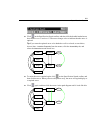
The following histogram shows the distribution of . To view this histogram:
E Click Bootstrap Distributions > GLS Discrepancy (implied vs pop) in the tree diagram in
the upper left pane of the Amos Output window.
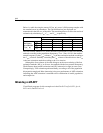
The following histogram shows the distribution of . To view this histogram:
E Click Bootstrap Distributions > ULS Discrepancy (implied vs pop) in the tree diagram in
the upper left pane of the Amos Output window.
C
GLS
α
ˆ
b
a,()
GLS discrepancy (implied vs pop) (Default model)
|--------------------
7.248 |**
11.076 |*********
14.904 |***************
18.733 |********************
22.561 |**************
26.389 |***********
30.217 |*******
N = 1000 34.046 |****
Mean = 21.827 37.874 |**
S. e. = .263 41.702 |***
45.530 |*
49.359 |*
53.187 |*
57.015 |*
60.844 |*
|--------------------
C
ULS
α
ˆ
b
a,()
ULS discrepancy (implied vs pop) (Default model)
|--------------------
5079.897 |******
30811.807 |********************
56543.716 |********
82275.625 |****
108007.534 |**
133739.443 |*
159471.352 |*
N = 1000 185203.261 |*
Mean = 43686.444 210935.170 |
S. e. = 1011.591 236667.079 |*
262398.988 |
288130.897 |
313862.806 |
339594.715 |
365326.624 |*
|--------------------