53
Testing Hypotheses
maximum likelihood estimates, and there is no reason to expect them to resemble the
implied covariances.
The chi-square statistic is an overall measure of how much the implied covariances
differ from the sample covariances.
In general, the more the implied covariances differ from the sample covariances, the
bigger the chi-square statistic will be. If the implied covariances had been identical to
the sample covariances, as they were in Example 1, the chi-square statistic would have
been 0. You can use the chi-square statistic to test the null hypothesis that the
parameters required to have equal estimates are really equal in the population.
However, it is not simply a matter of checking to see if the chi-square statistic is 0.
Since the implied covariances and the sample covariances are merely estimates, you
can’t expect them to be identical (even if they are both estimates of the same population
covariances). Actually, you would expect them to differ enough to produce a chi-square
in the neighborhood of the degrees of freedom, even if the null hypothesis is true. In
other words, a chi-square value of 3 would not be out of the ordinary here, even with a
true null hypothesis. You can say more than that: If the null hypothesis is true, the chi-
square value (6.276) is a single observation on a random variable that has an
approximate chi-square distribution with three degrees of freedom. The probability is
about 0.099 that such an observation would be as large as 6.276. Consequently, the
evidence against the null hypothesis is not significant at the 0.05 level.
Displaying Chi-Square Statistics on the Path Diagram
You can get the chi-square statistic and its degrees of freedom to appear in a figure
caption on the path diagram using the text macros
\cmin and \df. Amos replaces these
text macros with the numeric values of the chi-square statistic and its degrees of
freedom. You can use the text macro
\p to display the corresponding right-tail
probability under the chi-square distribution.
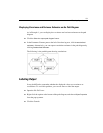
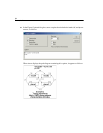
E From the menus, choose Diagram > Figure Caption.
E Click the location on the path diagram where you want the figure caption to appear.
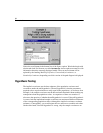
The Figure Caption dialog box appears.
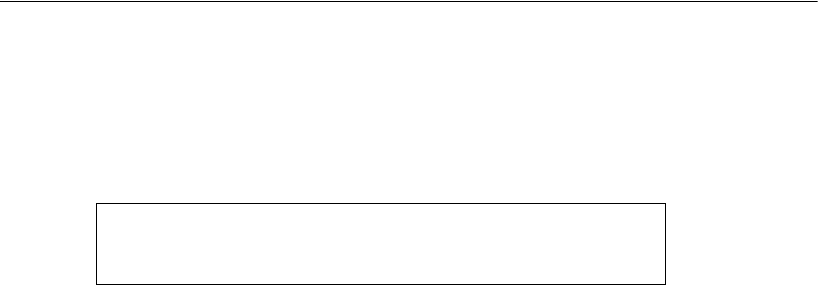
Chi-square = 6.276
Degrees of freedom = 3
Probability level = 0.099


